Slope of Hope Blog Posts
Slope initially began as a blog, so this is where most of the website’s content resides. Here we have tens of thousands of posts dating back over a decade. These are listed in reverse chronological order. Click on any category icon below to see posts tagged with that particular subject, or click on a word in the category cloud on the right side of the screen for more specific choices.
Itty Bitty Bit
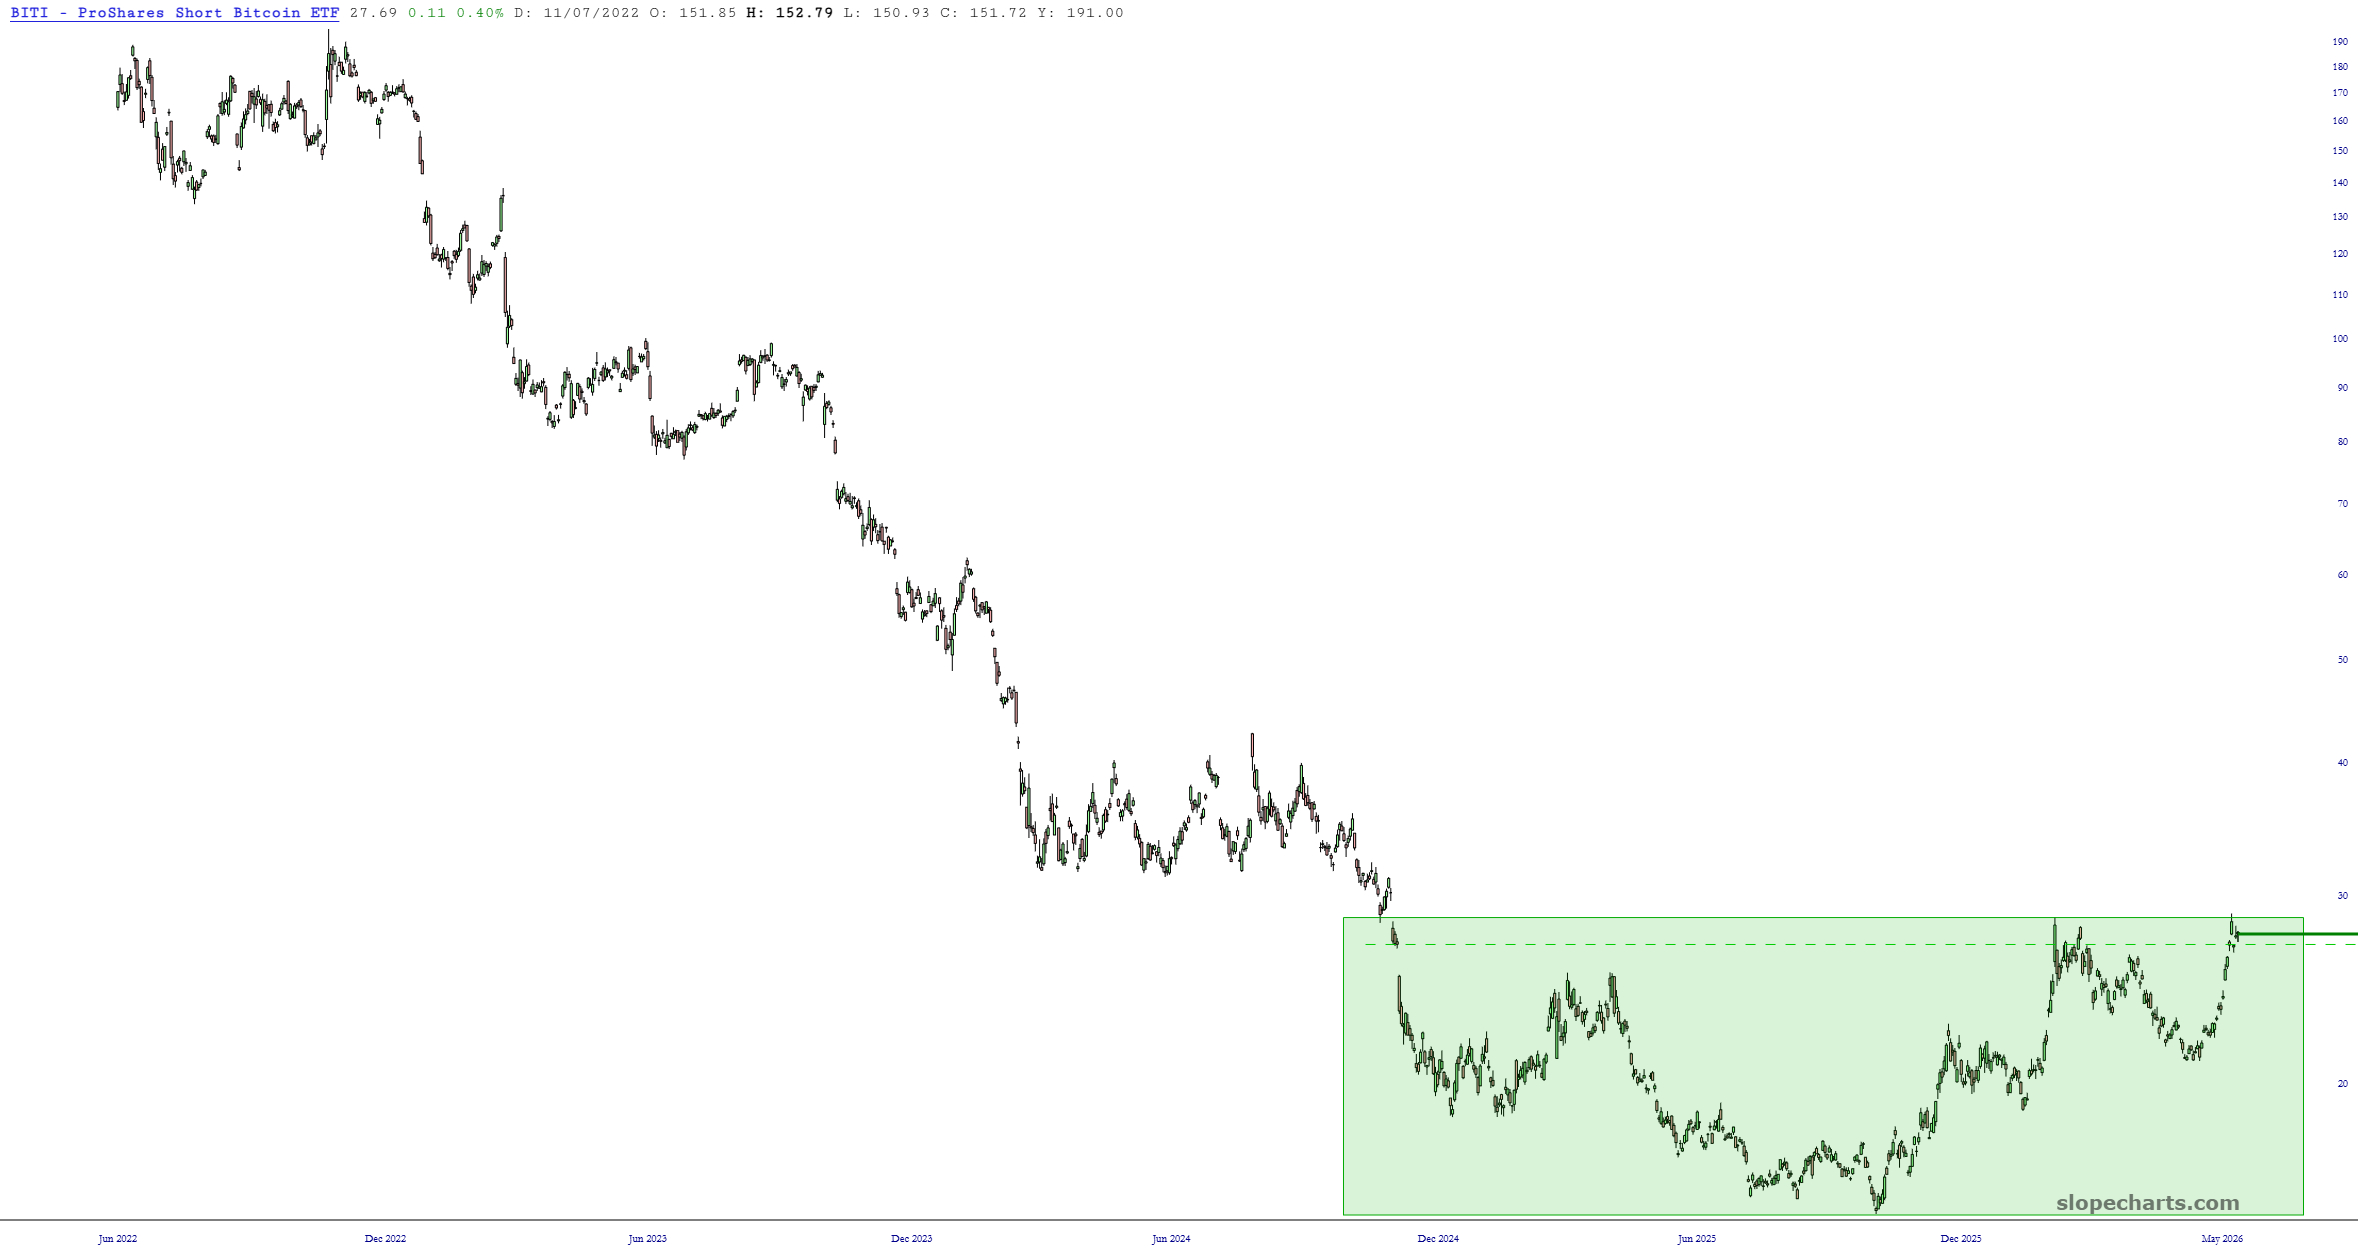
I’ll just say again, the bearish-on-Bitcoin fund BITI is looking like a potentially amazing inverted head and shoulders bullish bottom.
ETF Survey for SPCX Week
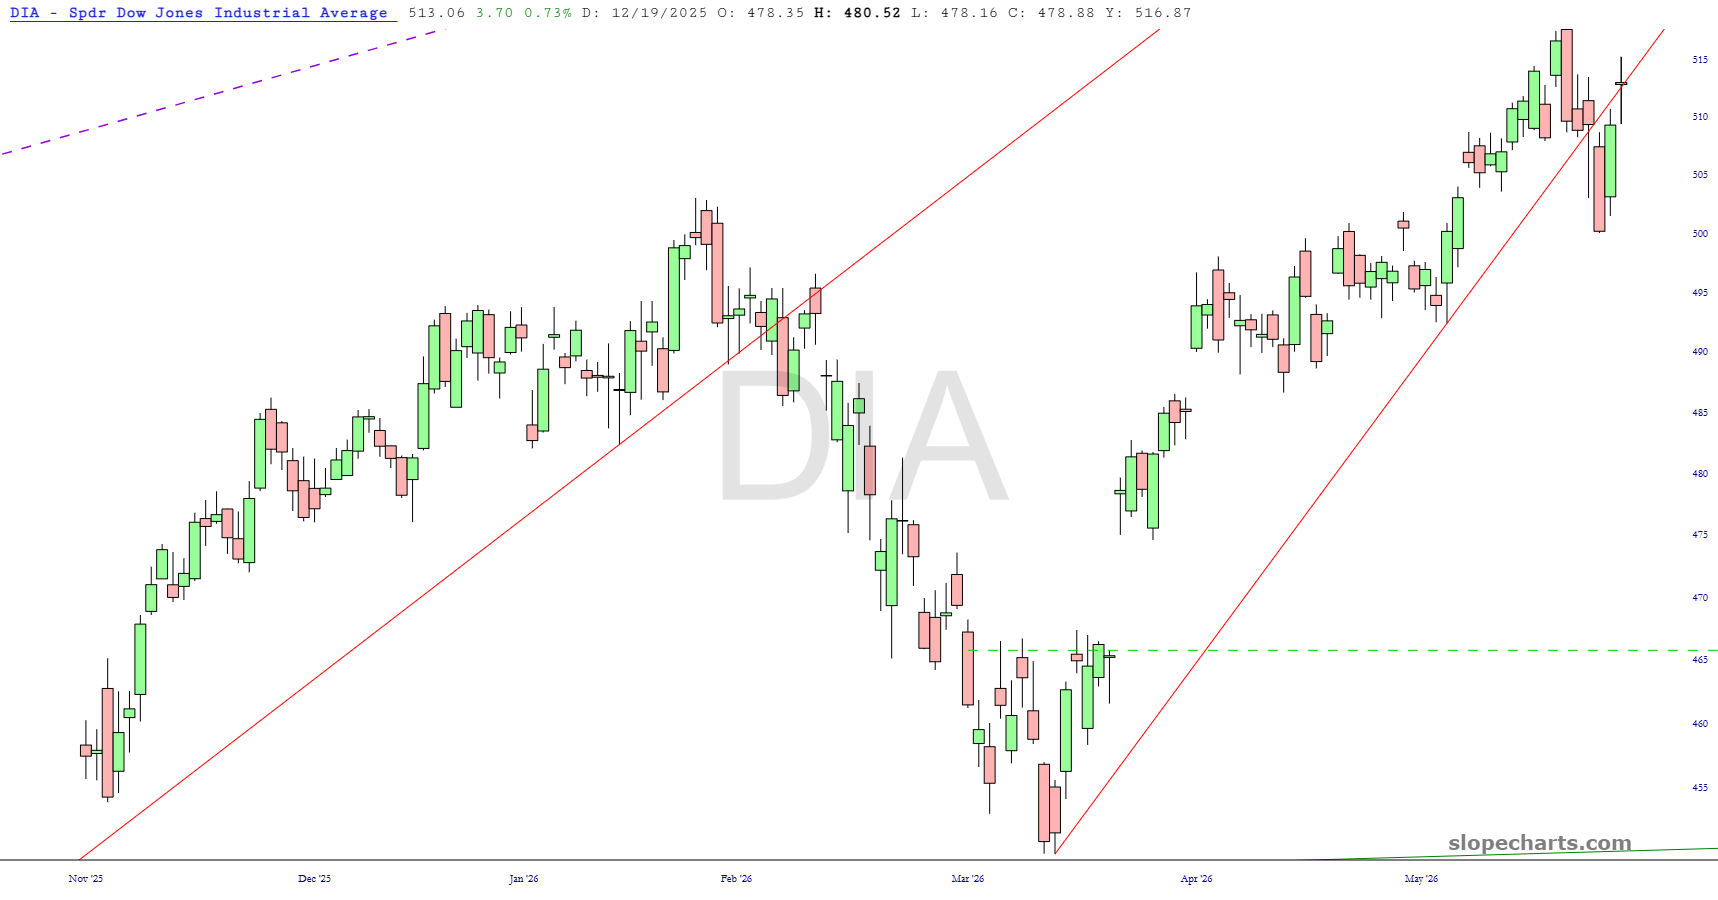
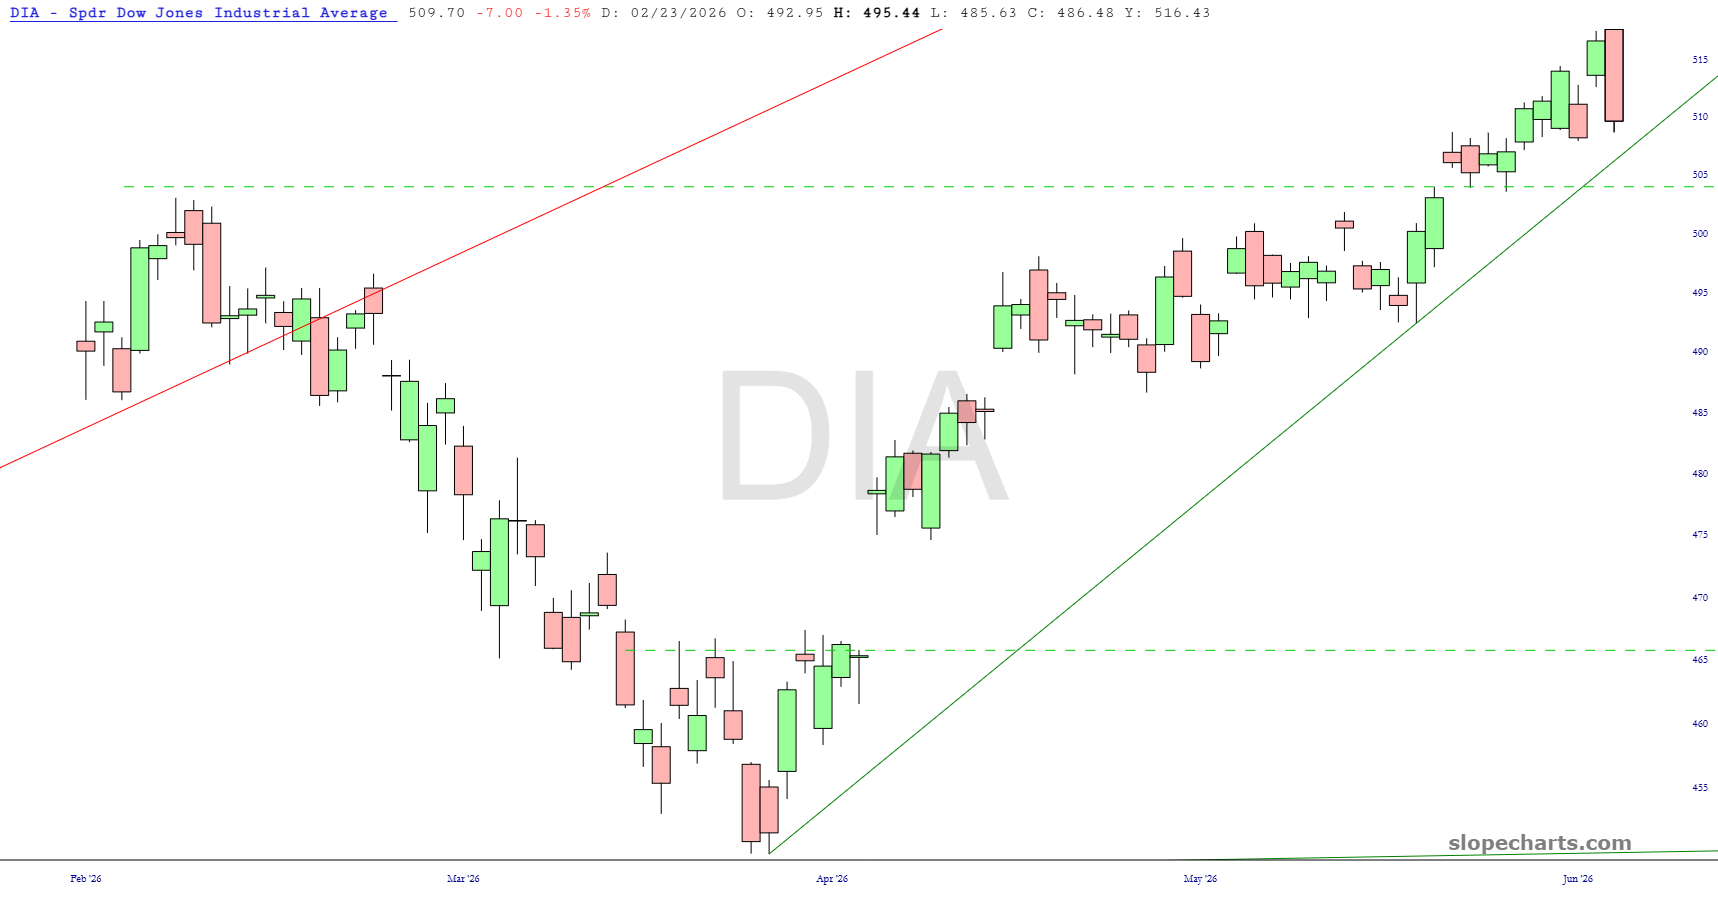
Let’s review where exchange traded funds are right now. We start with the Dow Industrials, which is still bullishly configured. The uptrend from March 30 remains intact.
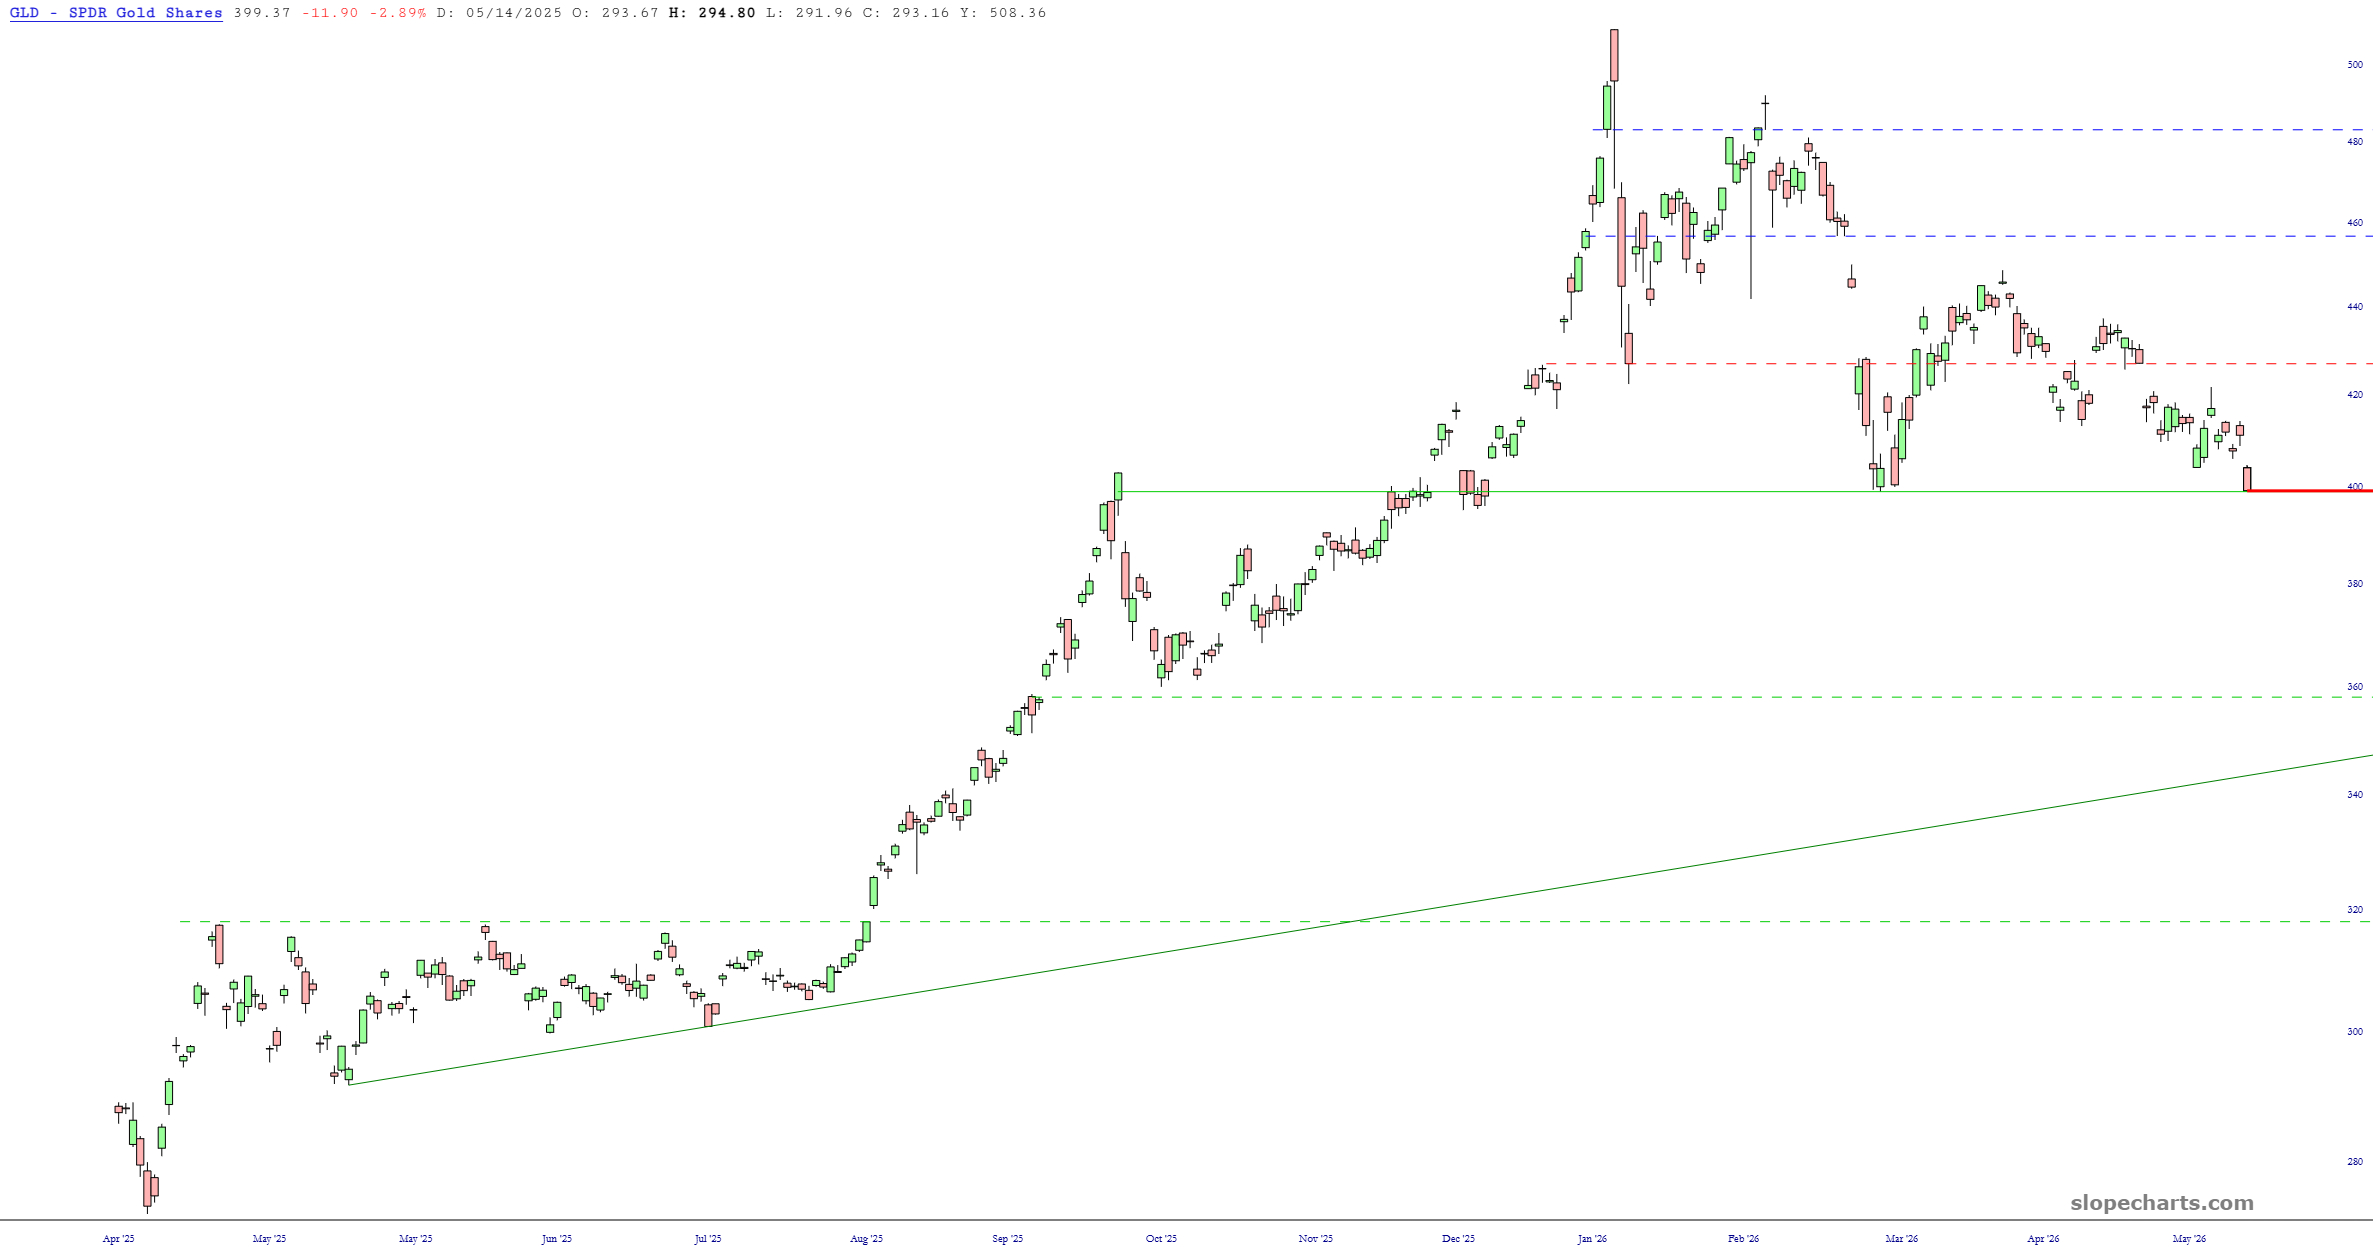
Good Gold Almighty
Precious metals were the hottest thing on the planet until early this year. Since then, they have fallen well out of favor, and I think it’s just going to get worse. Gold, shown below by way of GLD, seems poised to crack below a huge right triangle pattern.
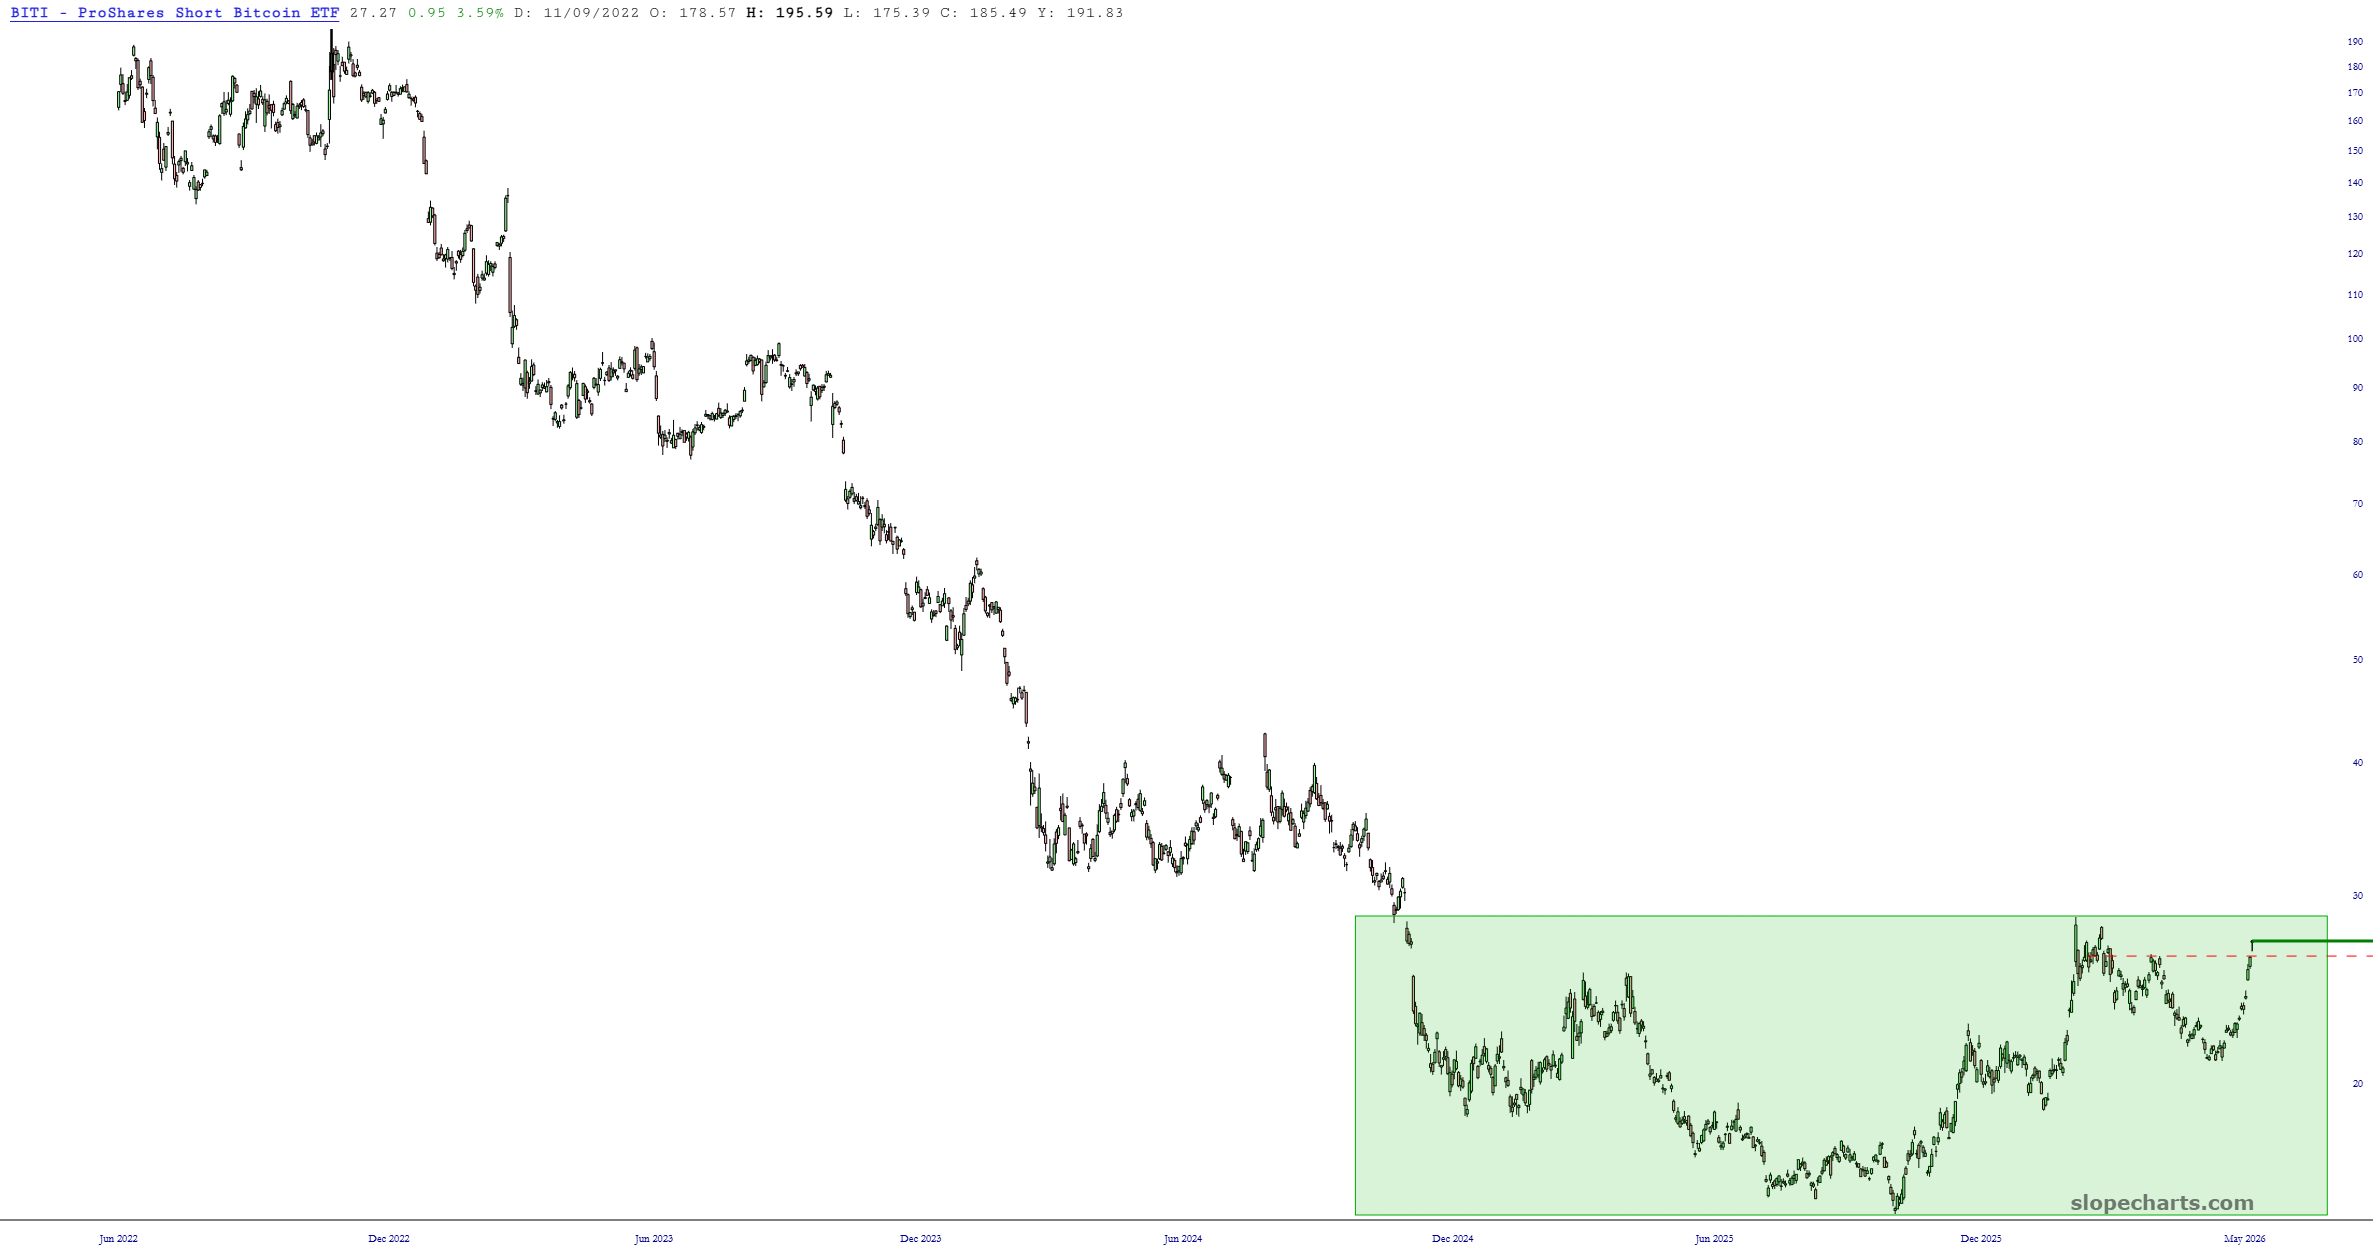
Gargantuan Bottom?
No, this isn’t another Oprah post. I’m talking about BITI, the inverse-on-BTC ETF which has hammered out what is looking like a sensational inverted H&S bottom. It isn’t quite complete, but if it crosses above $29, that suggests a measured move of about $43.