

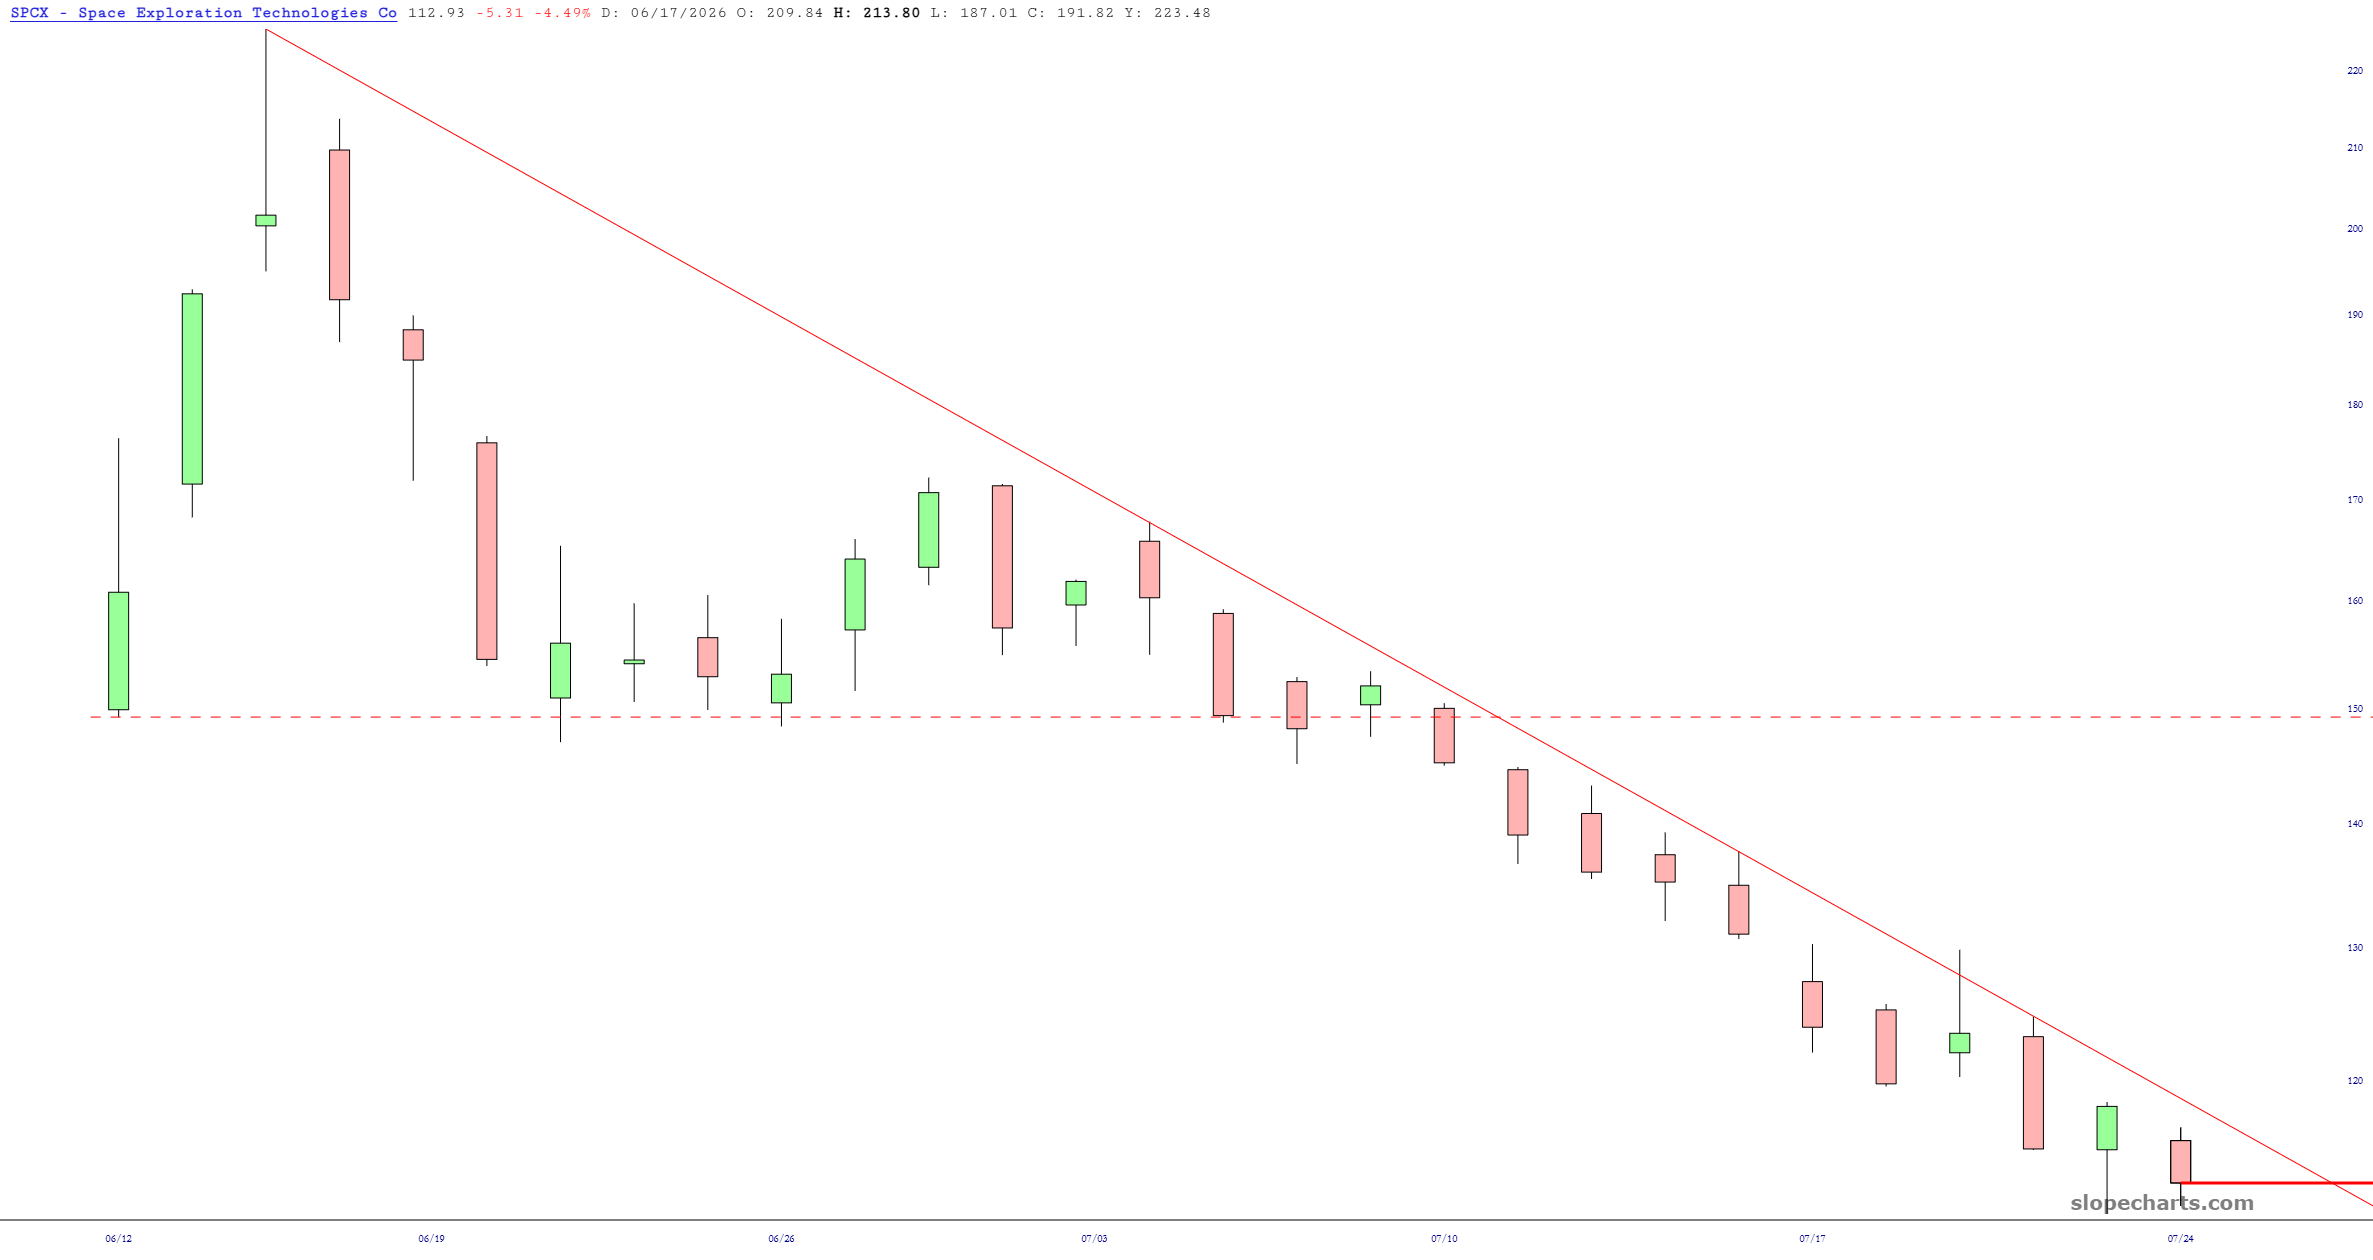
Poor SpaceX. Poor Elon. The IPO has been a complete shit-show, and the stock is worth less than HALF its peak price from only weeks ago. It’s just pathetic. Over a trillion dollars blown to pieces. When the hell is it going to stop falling?

Slope initially began as a blog, so this is where most of the website’s content resides. Here we have tens of thousands of posts dating back over a decade. These are listed in reverse chronological order. Click on any category icon below to see posts tagged with that particular subject, or click on a word in the category cloud on the right side of the screen for more specific choices.
Poor SpaceX. Poor Elon. The IPO has been a complete shit-show, and the stock is worth less than HALF its peak price from only weeks ago. It’s just pathetic. Over a trillion dollars blown to pieces. When the hell is it going to stop falling?
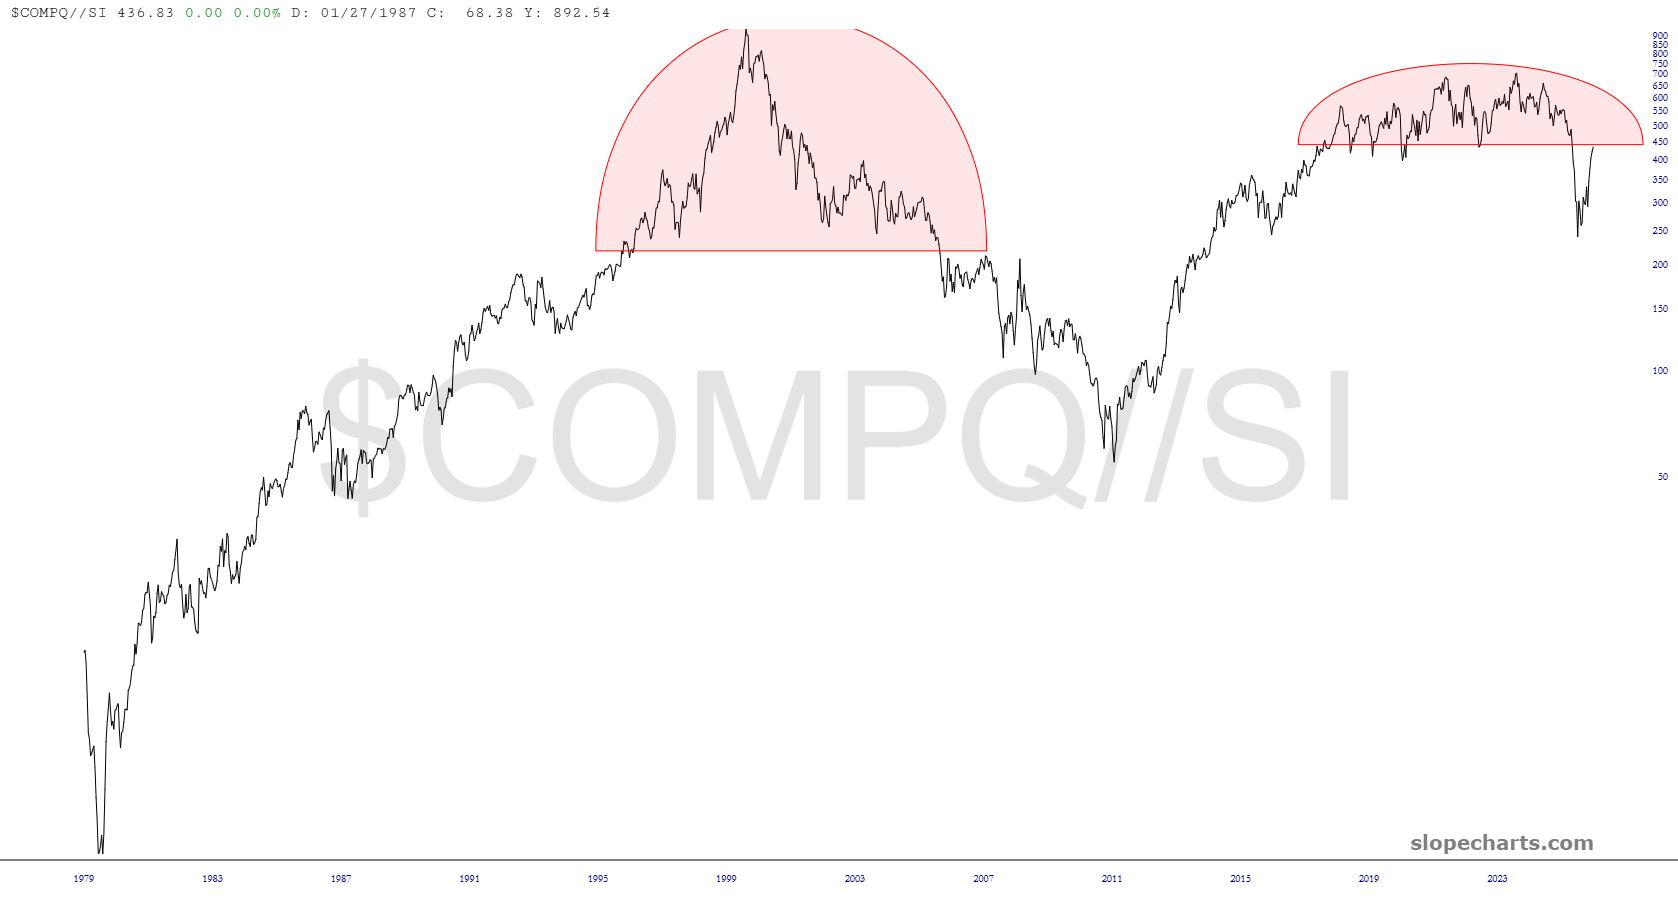
In spite of everything I said in the last post (in which I dismissed the notion of any market weakness in 2026), I’ve got to say that, looking at these long-term ratio charts, I asked myself one simple question: when was the last time that the market was configured like it is right now? The answer is either September 2007 or August 2008, depending on the chart. Hmmm. Gosh. What was about to happen back then?
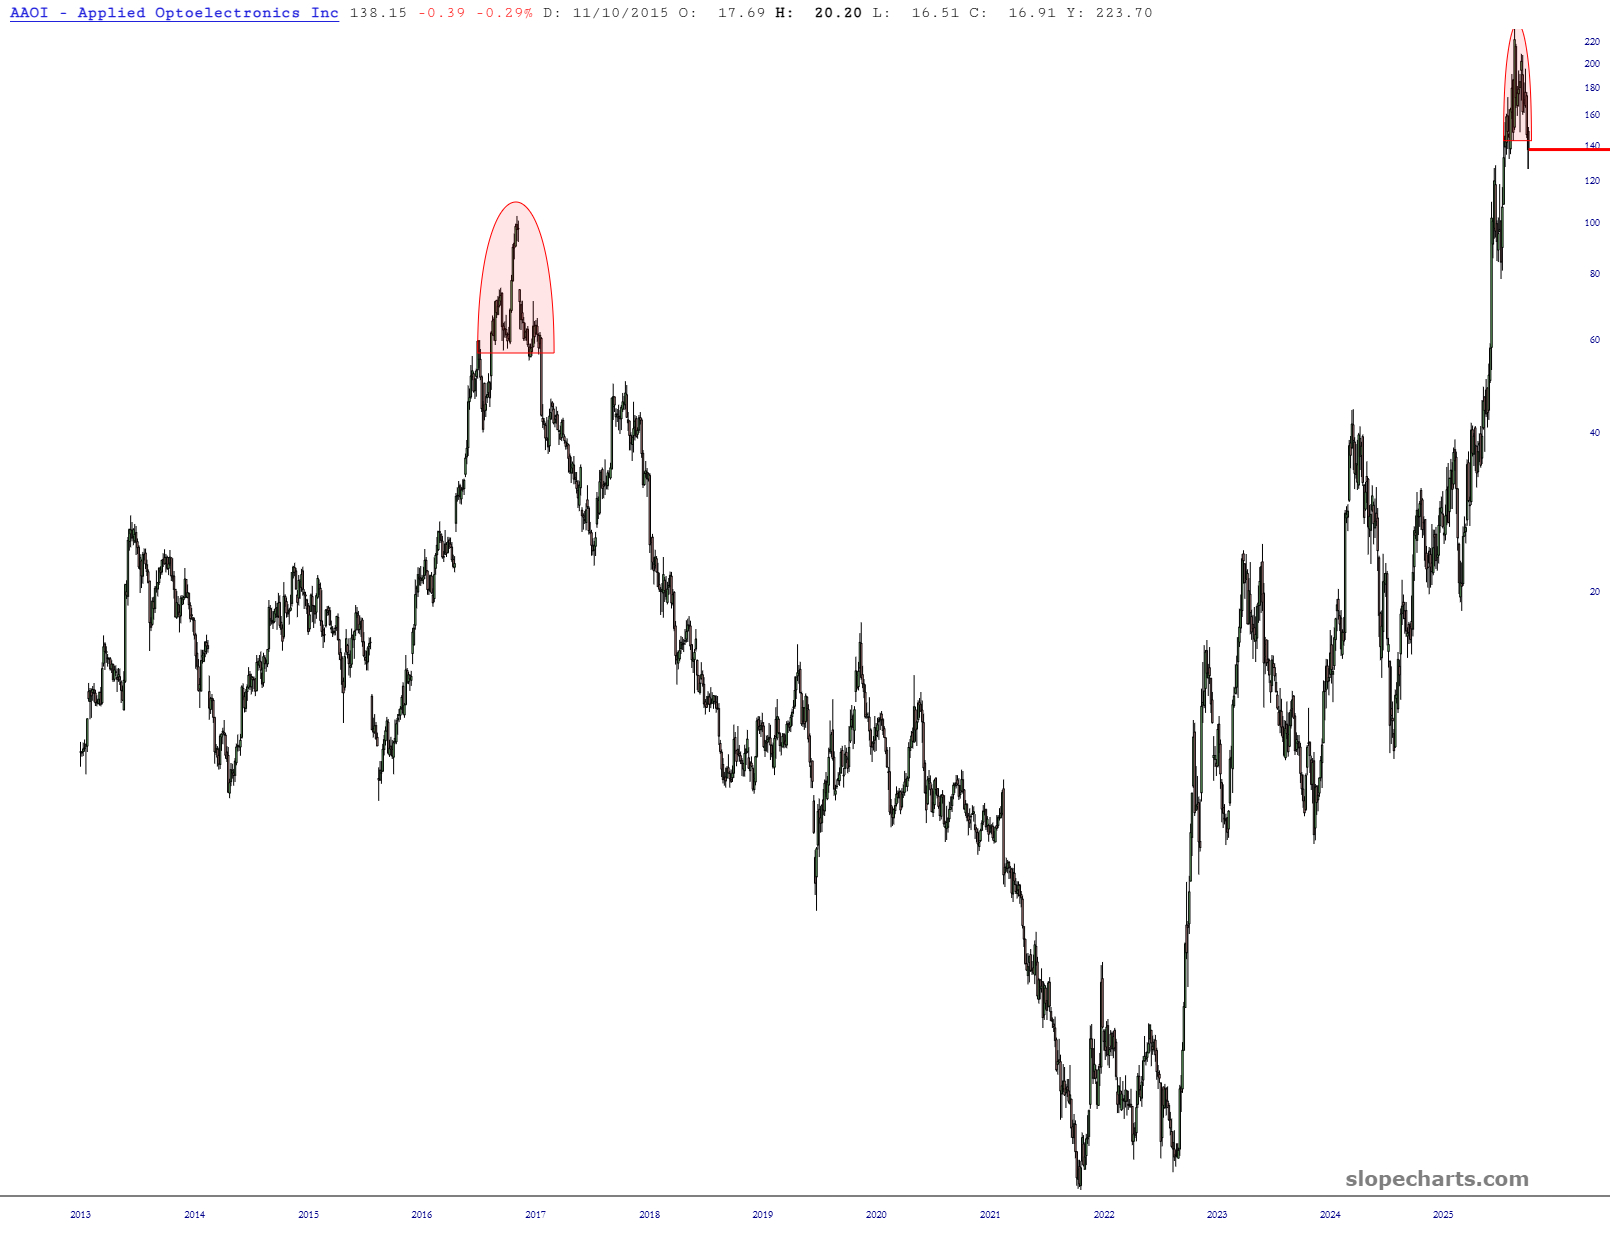
Clearly a bearish parallel with this semiconductor outfit:
Considering the exceptionally expensive IPOs coming at us, such as SpaceX, OpenAI, and Anthropic, I was curious as to historical examples of hotly anticipated IPOs and their correlation with market tops.
The clearest historical examples are these:
This is probably the strongest example. Palm’s carve-out IPO from 3Com priced at $38 on March 2, 2000, opened at $150, traded as high as $165, and closed at $95.06 on its first day — a 150% first-day gain. Within the same month, the stock had already fallen more than 50% from its first-day close.
The mania was extreme enough that Palm’s first-day valuation created the famous “Palm–3Com stub” anomaly: Palm traded so richly that, arithmetically, the rest of 3Com was being valued at a large negative amount. Chicago Booth describes this as an extreme case of mispricing.
(more…)This is a compelling analogy: