
Editor’s Note: What you are about to read is dead wrong. So keep reading, because there’s a correction later…………
As I mentioned when SlopeCharts was introduced, one advantage of forcing me off ProphetCharts (which I have been using for a dozen years) was that I would get a fresh perspective on the markets. With all my symbols, trendlines, and other embellishments gone, I’d be able to perhaps shake off some old biases (or at least reduce them).
In that spirit, I offer this rather surprising post, in which I offer up the prospect of equity markets rising another 10% or so. Now perhaps my stating such a thing – – me, the permabear, saying something broadly bullish – – will be taken by some as a sign of the market top. I’ll happily exchange ridicule for top-ticking a market in exchange for a true downtrend! But regardless, here we go……….
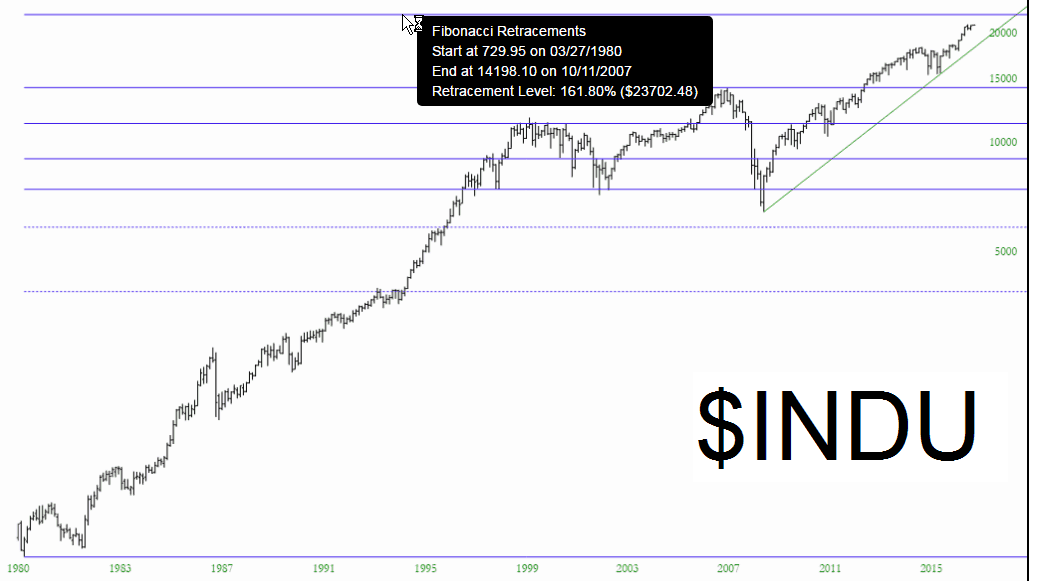
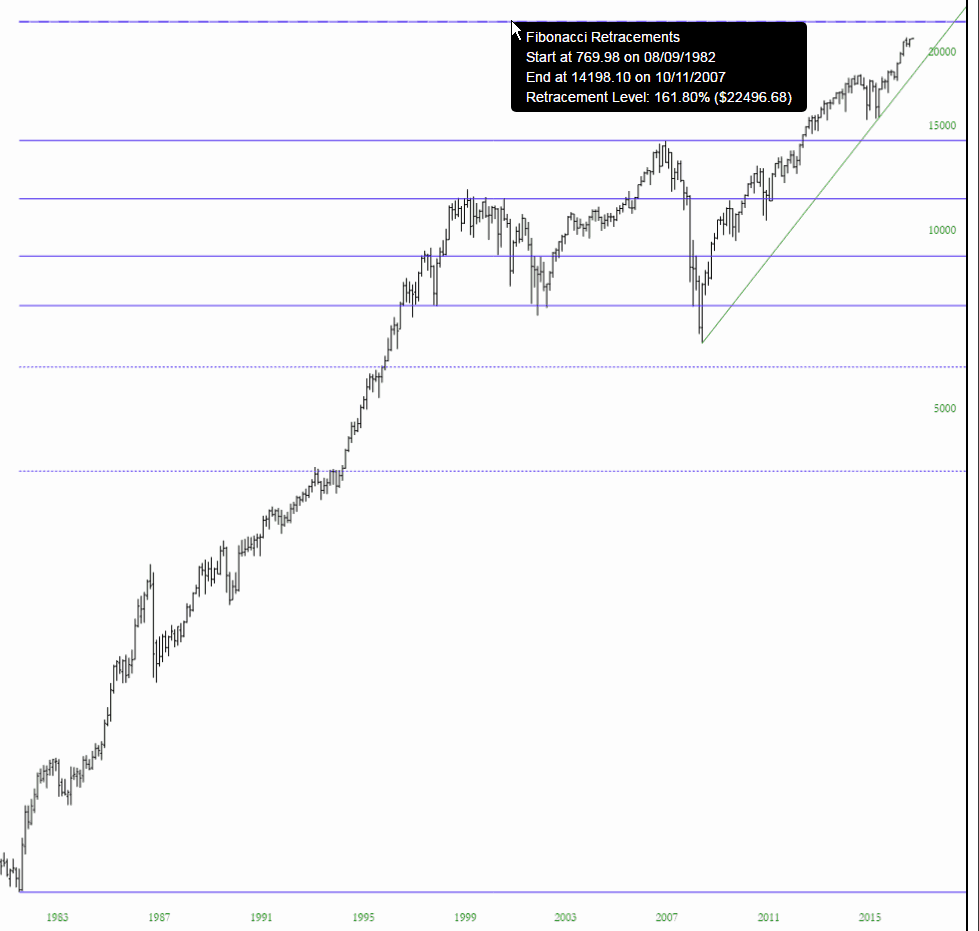
Where this came about was as I was messing around with some long-term index charts and trying out the Fibonacci retracement. I was quite taken by how “Fibonacci-friendly” (to use my term) they were. In other words, quite a few major areas of support and resistance were echoed by the retracement lines, so I decided to see where the next projection level higher would take us.
And – voila – here’s what we have on the S&P 500. On this chart, it looks like we’re a stone’s throw away, but it’s actually a good 200 points or so from here (2644 is the level), which is about 9% higher. There are plenty of folks (even our friends in Gainesville) calling for new lifetime highs, and that would line up with such projections.
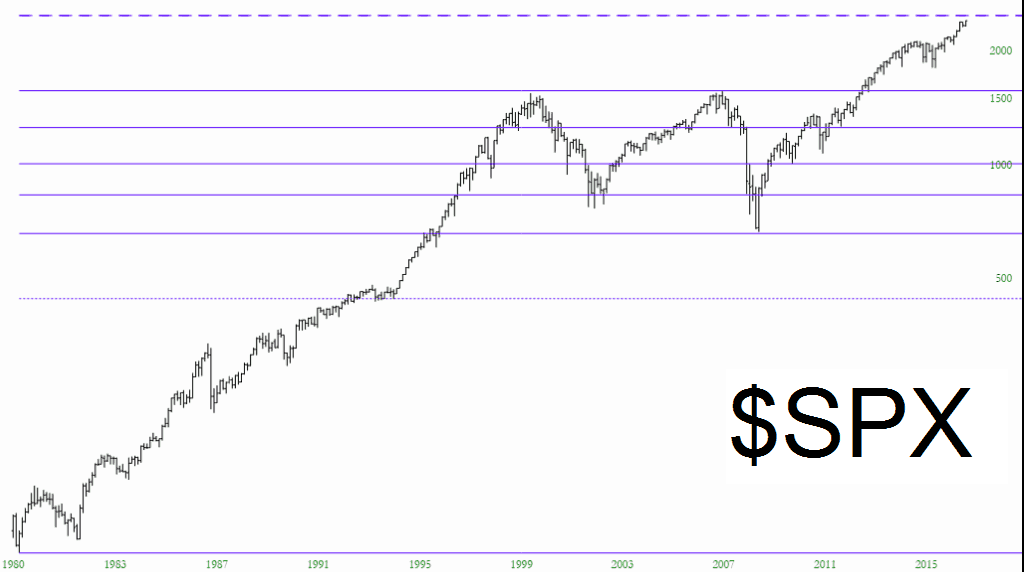
As for the Dow 30, the percentage change is (surprisingly) even higher, at about 12% from current levels.
To be clear, I don’t “want” this to happen, but something I’ve realized is that the markets don’t lay awake at night worrying about what Tim Knight wants. I remain very short specific sectors of the market, but these findings definitely tamp down my zeal about going hog-wild shorting stocks. Perhaps we have to endure another 10% or so in this completely artificial central-bank-fueled market before an honest-to-God, multi-year downturn takes place. And when that time comes…………God help everyone except Slopers, because it’s going to be apocalyptic.
WRONG!
OK, this is mildly amusing………allow me to explain:
Over the past couple of days I had this post waiting in the wings, it kept grinding at me that the target lines didn’t seem THAT far away. I don’t claim to have many marvelous properties, but there’s one thing I am very good at, and that is eyeballing something and making a determination (my gaydar, for instance, is unequaled; hire me if you need my services).
So as I was looking at this, I decided to run the math myself, and I discovered our calculation was simply incorrect. I confess, this is to my relief, because I really didn’t want to endure over 2,000 more S&P points, thank you very much. In any case, here is the, umm, accurate information.
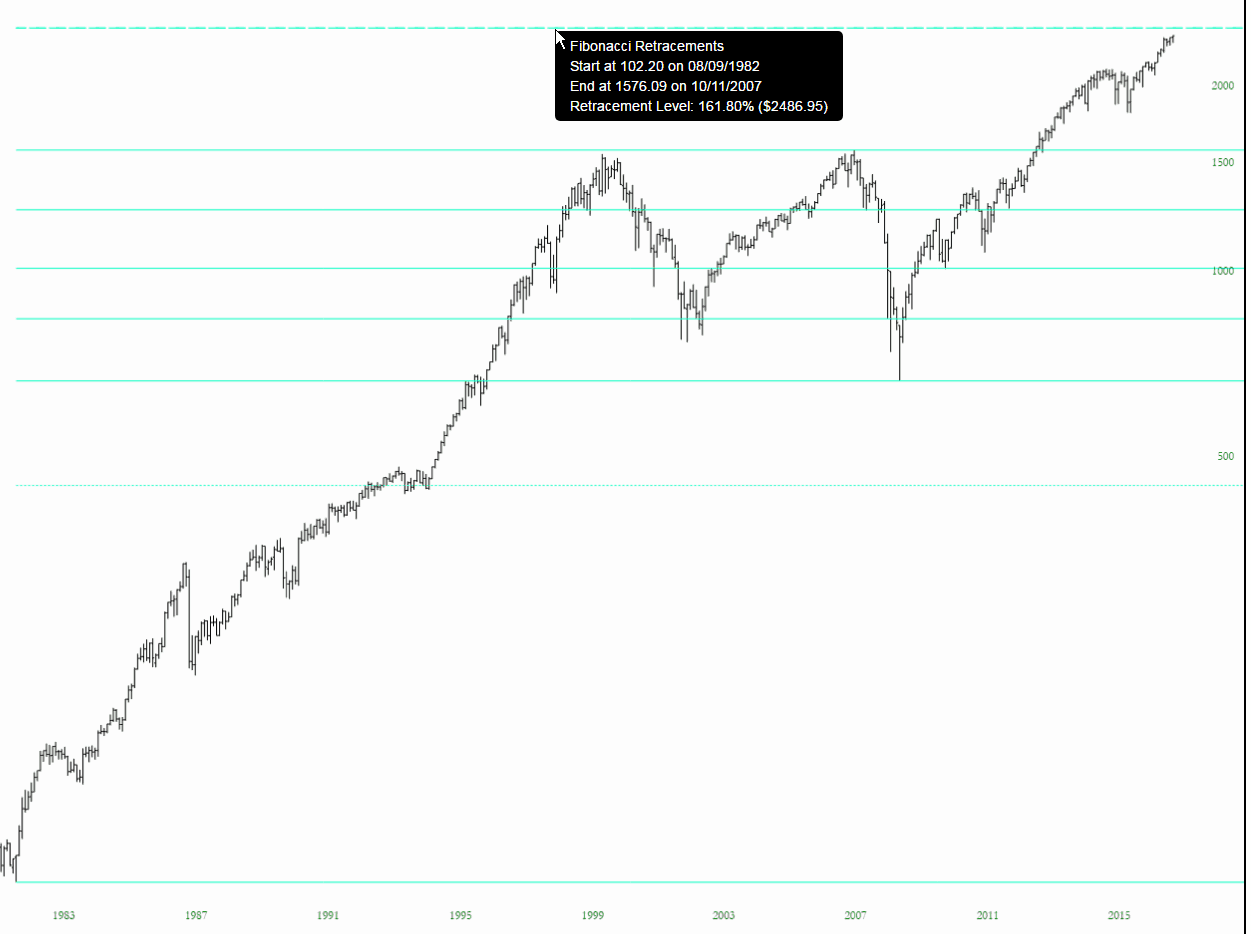
In other words, the extension projection for the S&P is about 2.9% away. The Dow, for whatever reason, has a more ambitious projection of about 6% higher.
In any event, it will be fascinating to see if these extensions actually hem prices in or not. I, for one, could endure three more percent on the S&P if the payoff if this gigantic. And, more importantly, this just shows how key it is to make sure a product that is in the active stages of development is actually providing good data! For a number of reasons, I’m glad I figured this out.
