
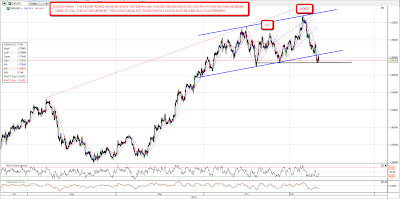
There was a very bullish scenario set up going into yesterday, but it entirely fell apart during the day. ES tested the previous high, and made a new high by one tick, but was rejected there and fell for the rest of the day. USD bounced hard and both EURUSD and GBPUSD broke their rising channels and fell to support levels that could well be necklines for building H&S patterns. GBPUSD has bounced to start a right shoulder since though EURUSD has remained subdued. Here's how it looks on EURUSD:
Even more encouragingly for the bears silver broke the support trendline for the recent strong uptrend, falling almost $3 over three hours on very high volume. Overnight silver returned to retest the broken support trendline and was rejected:

Silver looks likely to fall further which is very encouraging for the short side here. The gold:silver indicator will spike up and that's generally a very good indicator that equities will fall.
I've been reviewing a wide range of other indicators this morning and recent action on the Vix looks interesting, with a support level established in the 17.9 area, and what looks like a right angled and ascending broadening formation being established. There's room for the Vix to hit 23 within that pattern.

On balance the immediate outlook looks distinctly bearish, though I'm doubtful about a major interim top having been made. In recent days SPX has started to lead other markets to the upside, and that's a good sign that this move up is getting tired, but I'm don't think that we'll make the next major interim top before hitting the SPX IHS target in the 1244 – 1250 area. In terms of immediate retracement targets in the absence of a major interim top, the available downside without causing significant technical damage looks limited, as the main ES rising channel support trendline is just under 1200 SPX, with the next support trendline (green dotted line) at about 1193 SPX:
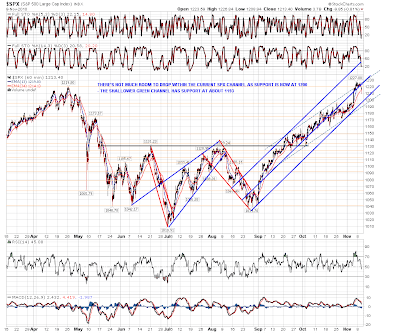
That lower target looks attractive today because a natural target for a retracement is the 20 day SMA on SPX. That's just over 1190 SPX at the moment and a hit near 1193 would be close enough to qualify as a support hit on that. The 20 day SMA has been very good support for this wave up as you can see from the chart below. What's also striking from the chart is how similar the current wave up has been to the wave from February this year to the high in April. I don't use analogs much as a rule but the similarity is really very striking and if the analog was to hold, we'd retrace to the 20 day SMA here and then make a slightly higher high with negative divergence on RSI before topping out. That actually fits my expectations pretty well so it will be interesting to see whether that plays out:

