
I did a recent post here and over on ZeroHedge which got a lot of views based on the SPY/GLD ratio. Some readers pointed out something that hadn’t occurred to me before: the ETF GLD didn’t even exist until November 2004, which means the ratio is really only valid starting on that day. (SPY, on the other hand, the first ETF, was created early in 1993).
I assumed incorrectly that ProphetCharts would only begin charting a ratio at the most recent start day for any symbol used. I assumed wrong. This would normally be excusable were it for not one inconvenient truth:
So this is obviously a bit embarrassing. I decided to try again, this time using data I knew went back the necessary amount. I couldn’t find the cash price for gold in the database, so I opted to use a rather obscure symbol, GC1600, which is an unadjusted continuous contract for gold. I also used the cash index for the S&P, as opposed to the SPY, since the latter is adjusted for dividends. Here’s the chart:
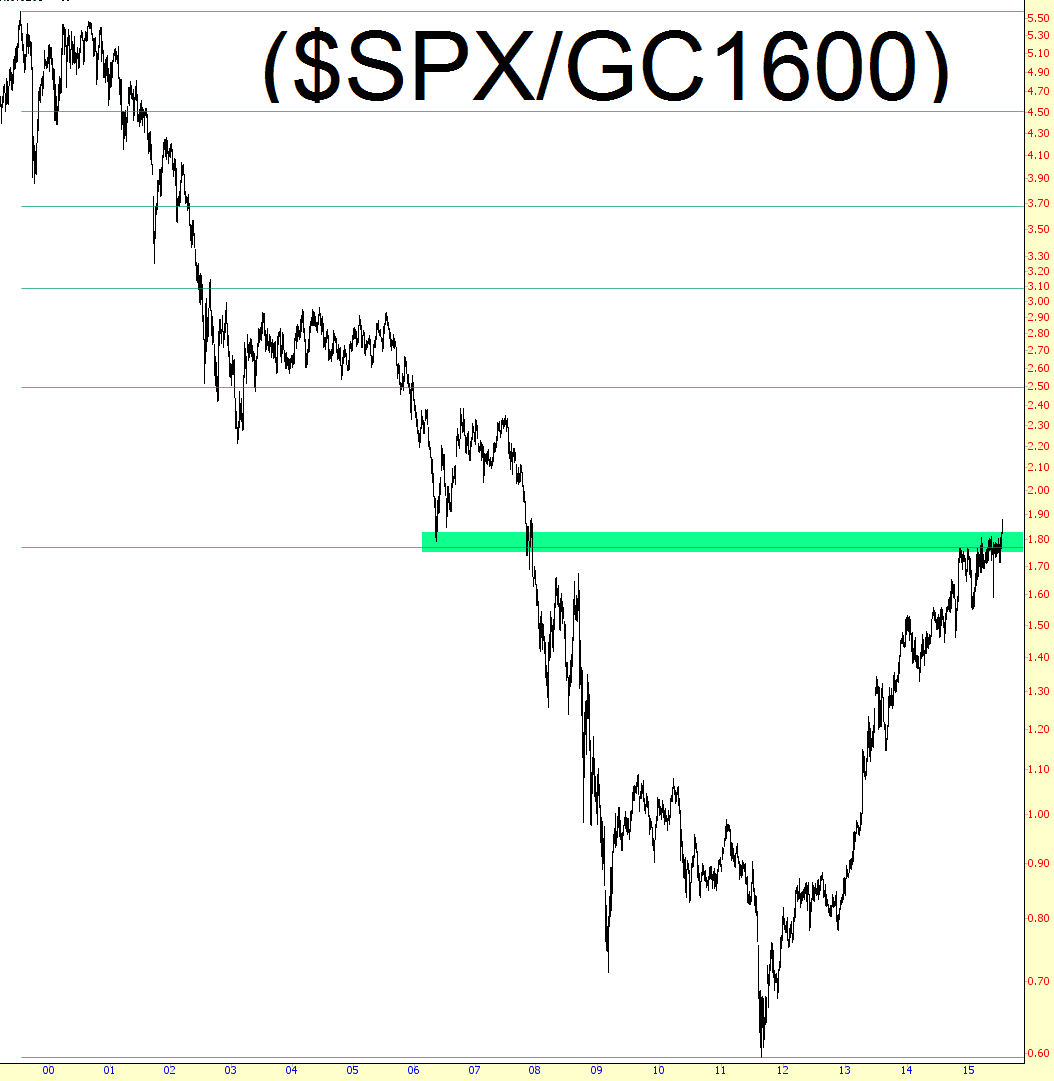
The bad news is that the oh-so-perfect trendline that I illustrated in the original chart simply doesn’t apply here. The consolation prize is that a Fibonacci retracement for the entire history of the chart yields some mildly interesting support and resistance areas. We are appearing to be in the thicket of some resistance right now, which certainly suggests a reversal, although not as fervently as the former chart did.
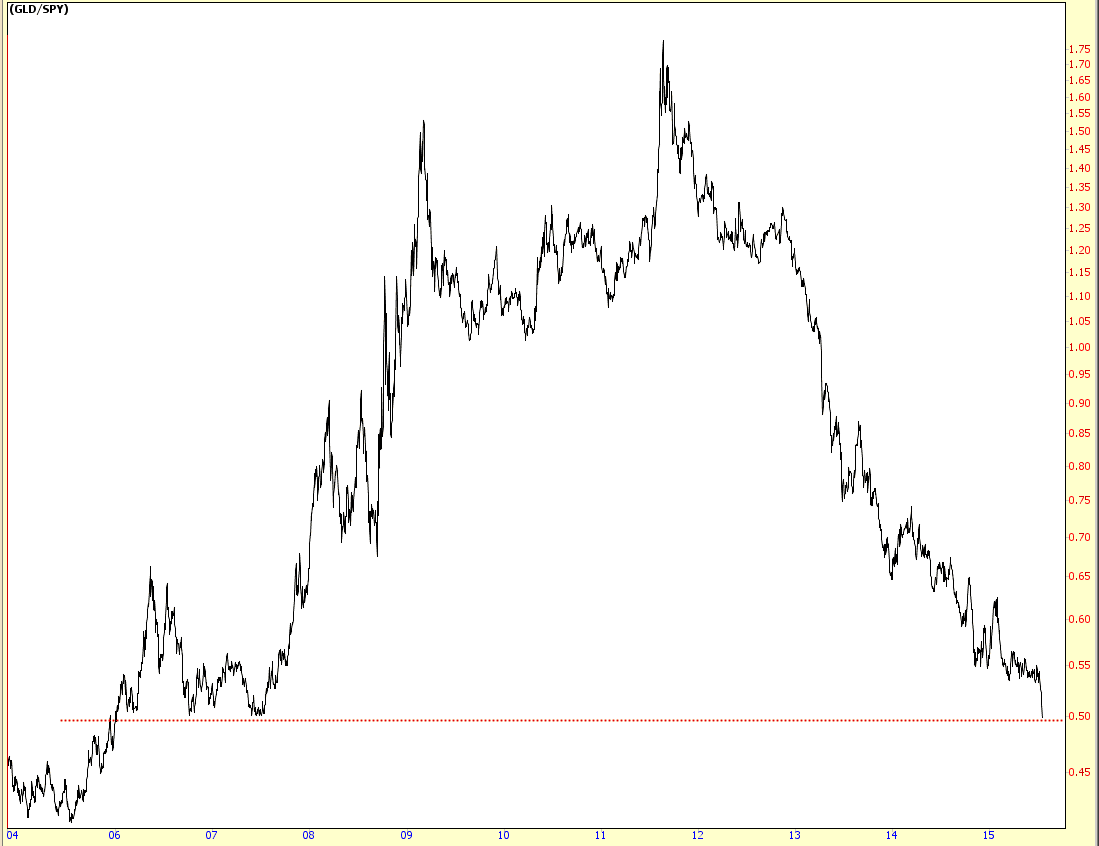
I also took a different approach by trying GLD/SPY, and in that instance, ProphetCharts is smart enough to only begin the graph at GLD’s inception. Here’s what the chart looks like, and as you can see, it has thrust down to an interesting point not seen for about a decade:
I appreciate readers calling this to my attention (although next time, email me – – it was sheer chance I saw the remark in the comments section!) I wanted to correct the chart as soon as I had time to have a closer look.
