Hedging costs after Thursday's market meltdown
Last week, with the debt ceiling negotiations dragging on, we looked at the costs of hedging a handful of equity index, gold-, Treasury bond-, and dollar index-tracking ETFs. Below is a snap shot showing the current hedging costs of the same basket of ETFs after Thursday's market meltdown. Before that though, a look at how a couple sets of index ETF puts fared during Thursday's market meltdown.
SPY puts
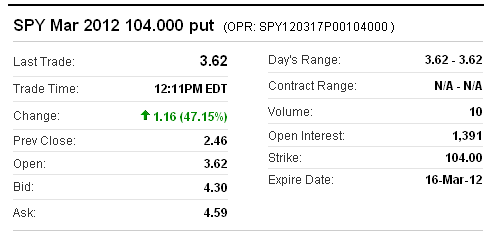
For a Seeking Alpha post Wednesday, I used Portfolio Armor to pull up the optimal puts to hedge against a greater-than-20% drop in SPY over the next several months. Usually, I don't keep track of what the optimal puts are for these articles, I just post the costs. As it happened though, someone asked me what they were, so I made a note of them. They were the $104 strike, March 2012 puts. Here's what happened to them Thursday.
DIA puts
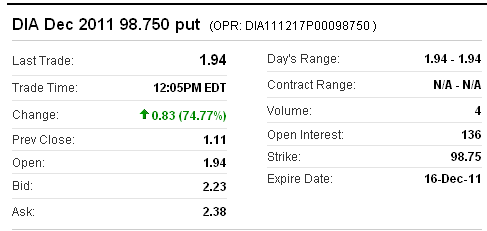
These puts I kept track of because I own them. In late June, I used Portfolio Armor to find the optimal put options to hedge against a greater-than-20% drop in DIA, which turned out to be the $98.75 strike, December puts. Here's what happened to those puts Thursday.
Current hedging costs: an update on last week's table
Hedging against a >30% correction in stocks
The table below shows the costs, as of Thursday's close, of hedging the same 5 equity index ETFs against greater-than-30% corrections over the next several months, using optimal puts.
Current Hedging against a >15% correction in bonds, gold, and the dollar
The table also shows the costs of hedging the same gold-, U.S. dollar-, and Treasury Bond-tracking ETFs against greater-than-15% declines over the next several months using optimal puts. First, a quick reminder about what optimal puts are, and a note about costs.
Optimal puts
Optimal puts are the ones that will give you the level of protection you want at the lowest possible cost. As University of Maine finance professor Dr. Robert Strong, CFA has noted, picking the most economical puts can be a complicated task.
With Portfolio Armor (available on the web, and as an Apple iOS app), you just enter the symbol of the stock or ETF you're looking to hedge, the number of shares you own, and the maximum decline you're willing to risk (your threshold – you can enter any percentage you like, but the larger the percentage, the greater the chance there will be optimal puts available for the position). Then the app uses an algorithm developed by a finance Ph.D. to sort through and analyze all of the available puts for your position, scanning for the optimal ones.
A note about costs
To be conservative, Portfolio Armor calculates hedging costs using the ask price of the optimal puts. In many cases, you may be able to buy the puts for a lower cost (between the bid and the ask prices).
Hedging Costs as of Thursday's Close
|
Symbol |
Name |
Cost of Protecting against >30% Decline, as % of position |
|
Equity Index ETFs |
||
|
QQQ |
PowerShares QQQ Trust |
1.50%* |
|
SPY |
SPDR S&P 500 |
1.78%* |
|
DIA |
SPDR Dow Jones Industrial Avg |
1.61%* |
| EFA | iShares MSCI EAFE Index | 2.65%* |
| EEM | iShares MSCI Emerging Markets | 2.80%* |
| Symbol | Name | Cost of Protecting against a >15% Decline, as % of position |
| U.S Dollar ETF | ||
| UUP | PowerShares DB US Dollar Index | 0.51%* |
| U.S. Treasury Bonds | ||
| TLT | iShares Barclays 20+ Yr Treas | 1.97%* |
|
Gold |
||
|
GLD |
SPDR Gold Trust |
1.77% |
*Based on optimal puts expiring in March, 2012.
