Slope of Hope Blog Posts
Slope initially began as a blog, so this is where most of the website’s content resides. Here we have tens of thousands of posts dating back over a decade. These are listed in reverse chronological order. Click on any category icon below to see posts tagged with that particular subject, or click on a word in the category cloud on the right side of the screen for more specific choices.
Best Shorts for a New Year (Part A)
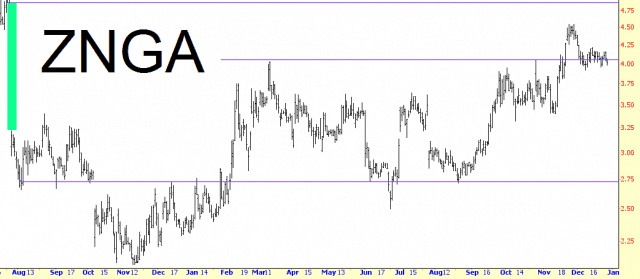
Zynga Will Get Zapped
Just a one-chart music…….along the same lines as my LinkedIn post, it just seems to me that as amazing a year as this has been for social media stocks, Zynga’s performance, relatively speaking, has been pretty sad. It did a decent job filling its gap (represented by the green tint), and my hunch is that it’s just going to languish in the low single digits, with occasional barfage along the way. This company peaked, I’d say, just before it IPO’d.
Stock Market Bubbles 1982–2013
Sent in from thoughtful Sloper Permabear…..
1982 – 1987
August 9, 1982 SPX 102.02
August 25, 1987 SPX 337.90
1,276 trading days, 24.4% annualized return.
October 20, 1987 SPX 216.46
39 trading days, 35.9% Correction
1987 – 2000
October 20, 1987 SPX 216.46
March 24, 2000 SPX 1553.21
3,141 trading days, 15.69% annualized return
October 10, 2002 SPX 768.63
638 trading days, 50.5% Correction
2002 – 2007
October 10, 2002 SPX 768.63
October 11, 2007 SPX 1575.83
1,259 trading days, 14.26% annualized return
March 9, 2009 SPX 666.79
352 trading days, 57.7% Correction
2009 – 2013
March 9, 2009 SPX 666.79
December 27, 2013 SPX 1844.89
1,212 trading days, 21% annualized return
The trend is your friend, and the long-term trend is for higher highs and larger corrections. In Dirty Harry’s famous words, “Do you feel lucky, today?”
