As I type this, the markets have surged yet again, thanks to more backpedaling from the President. I pulled the charts for this post before this latest surge, but the purpose is the same: what indicators were most helpful in nailing the bottom we saw in mid-August? I offer some SlopeCharts below, with remarks captioned for each.
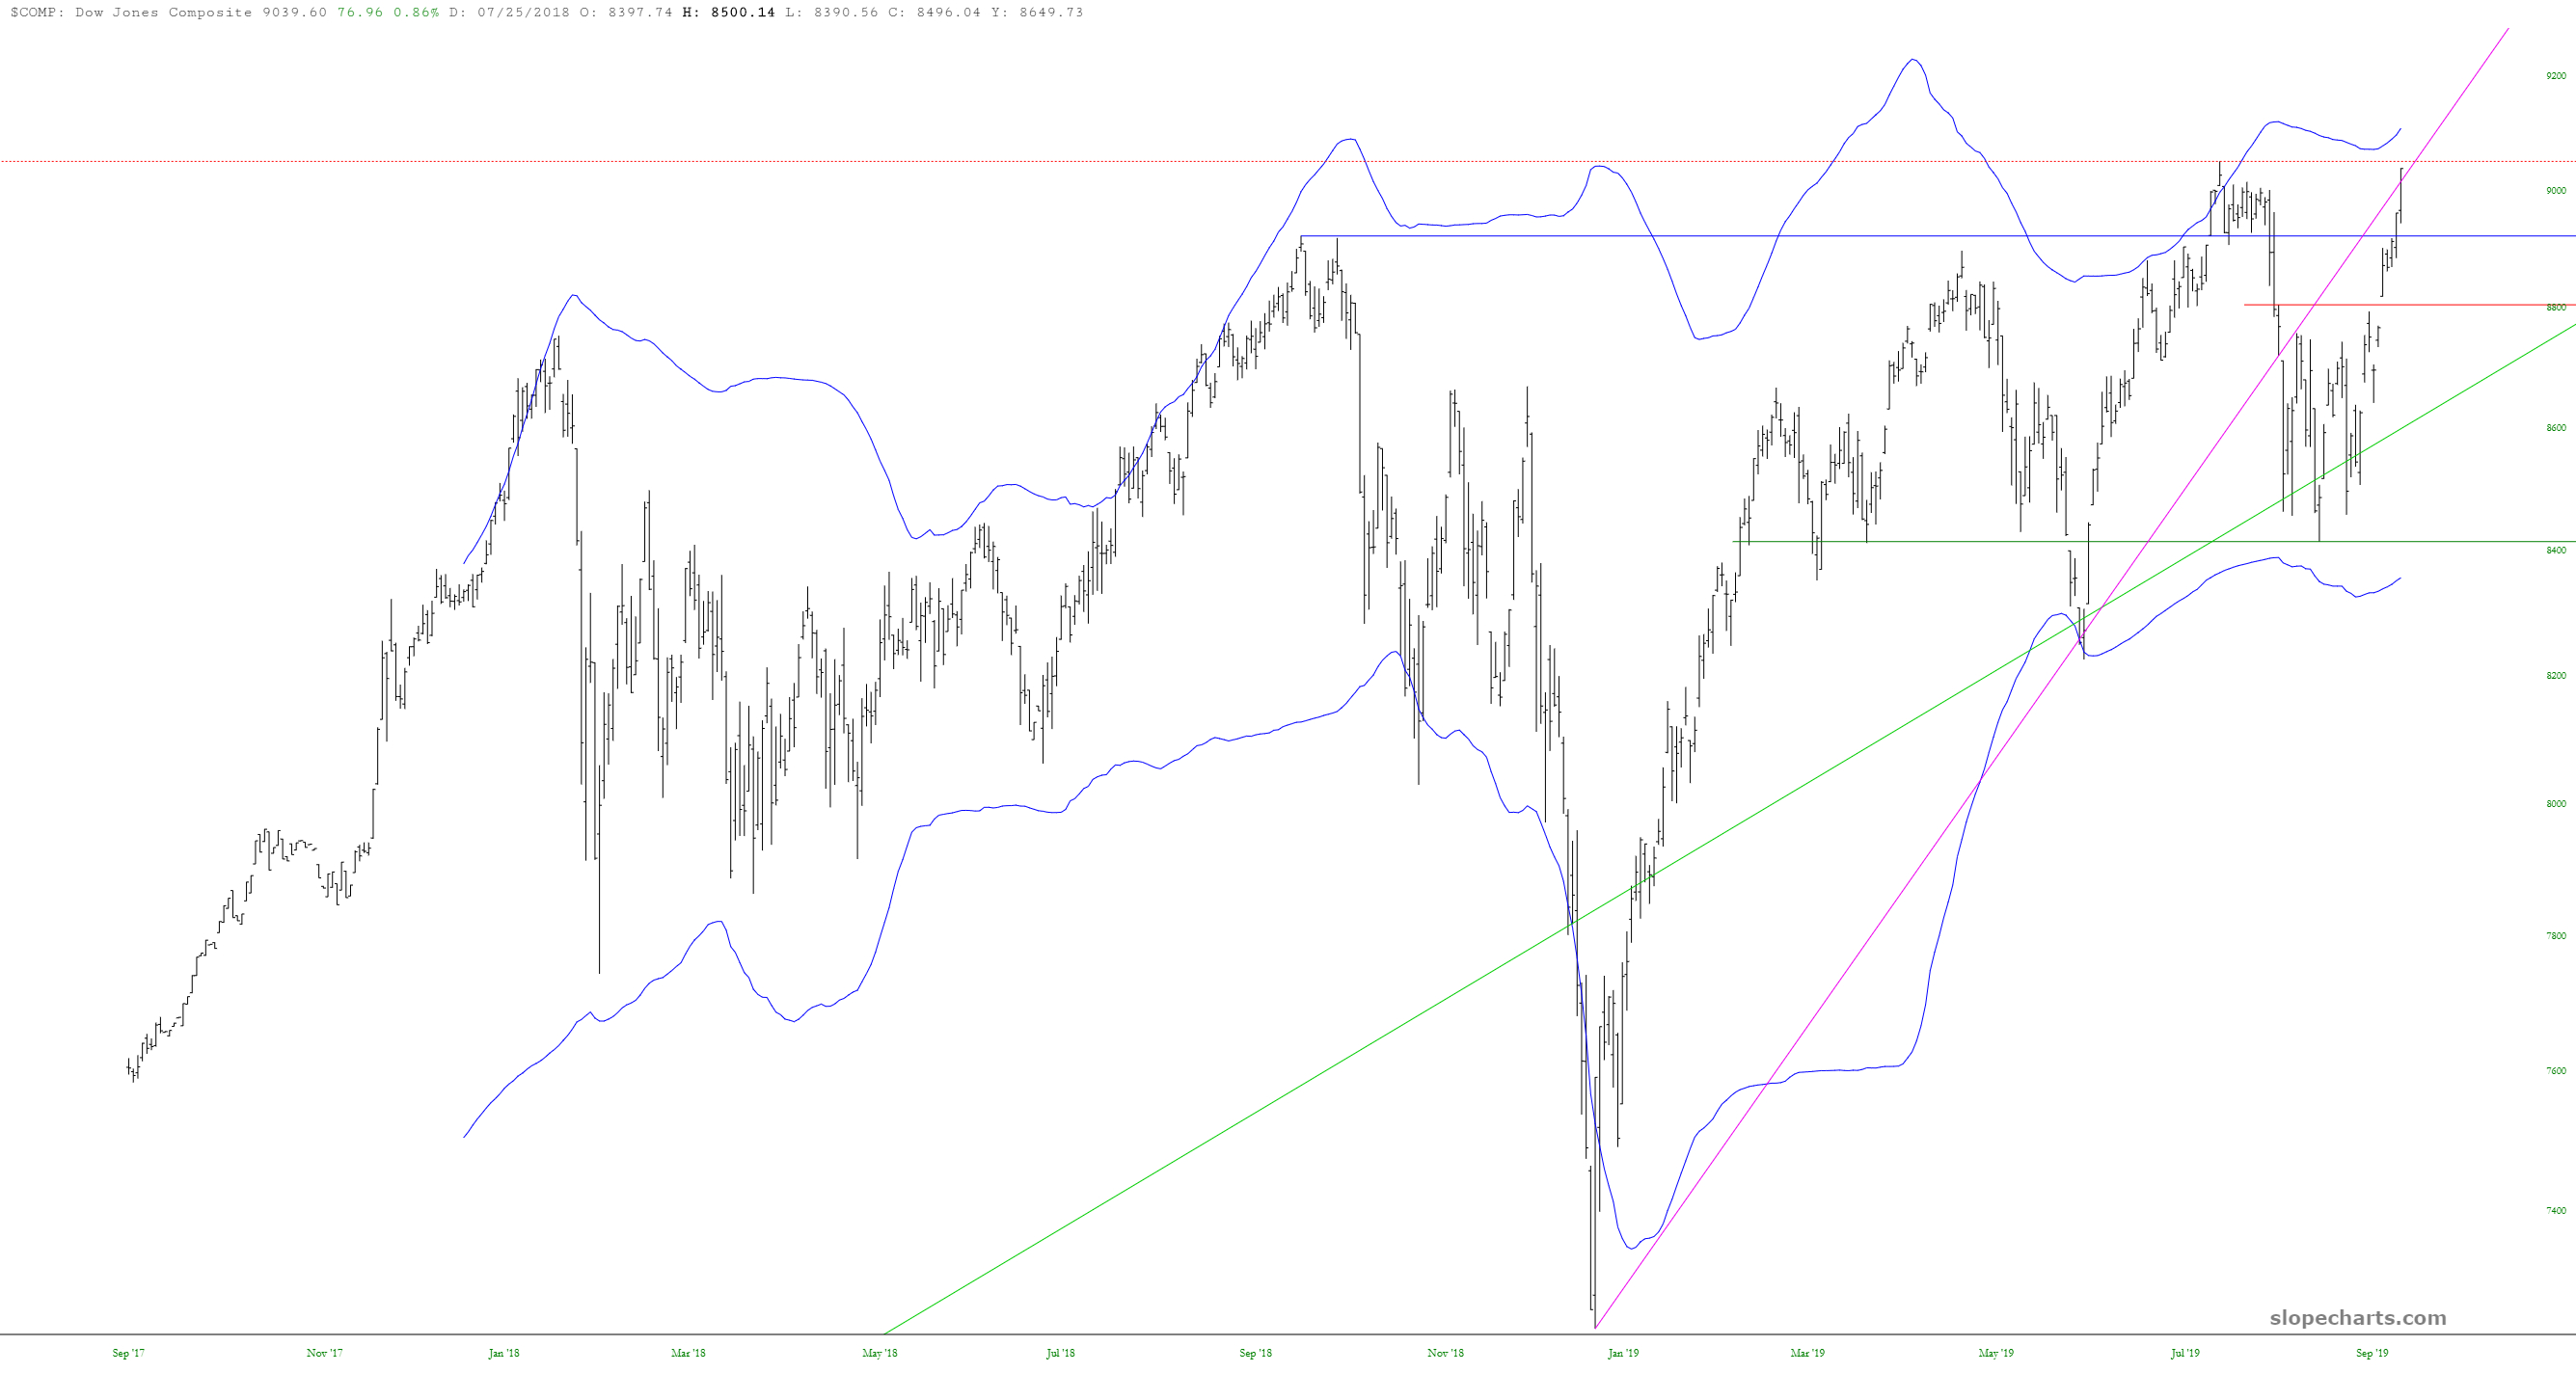
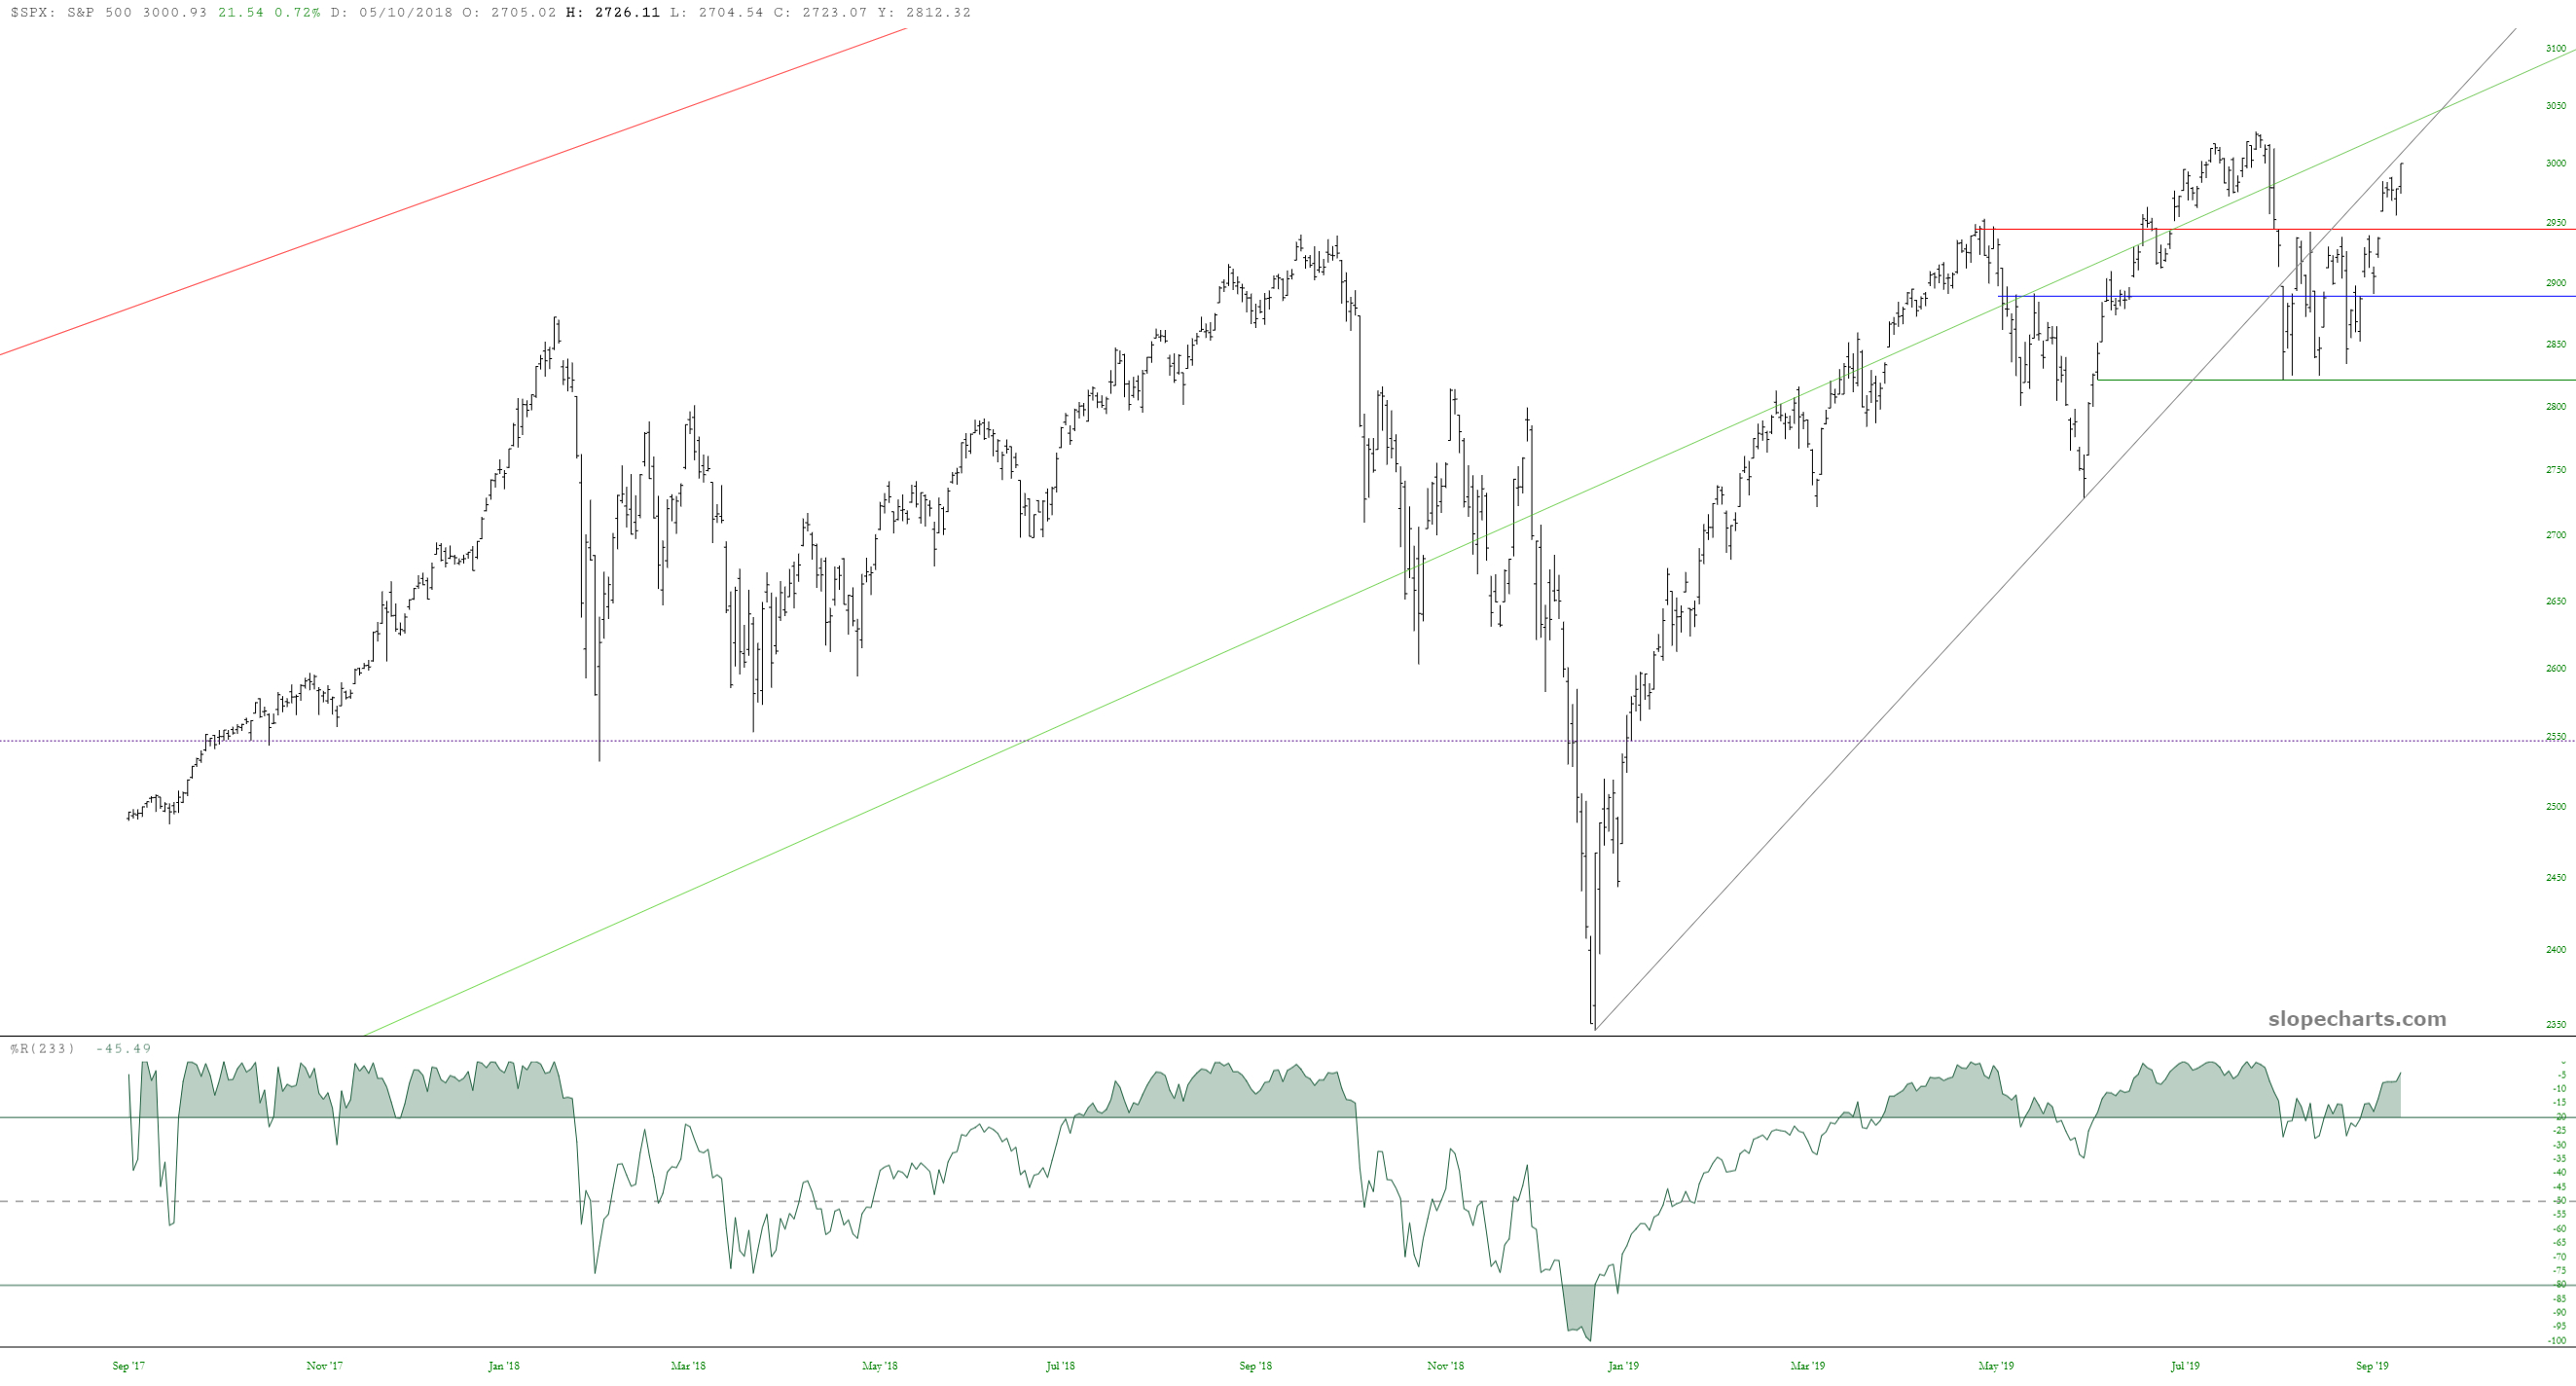
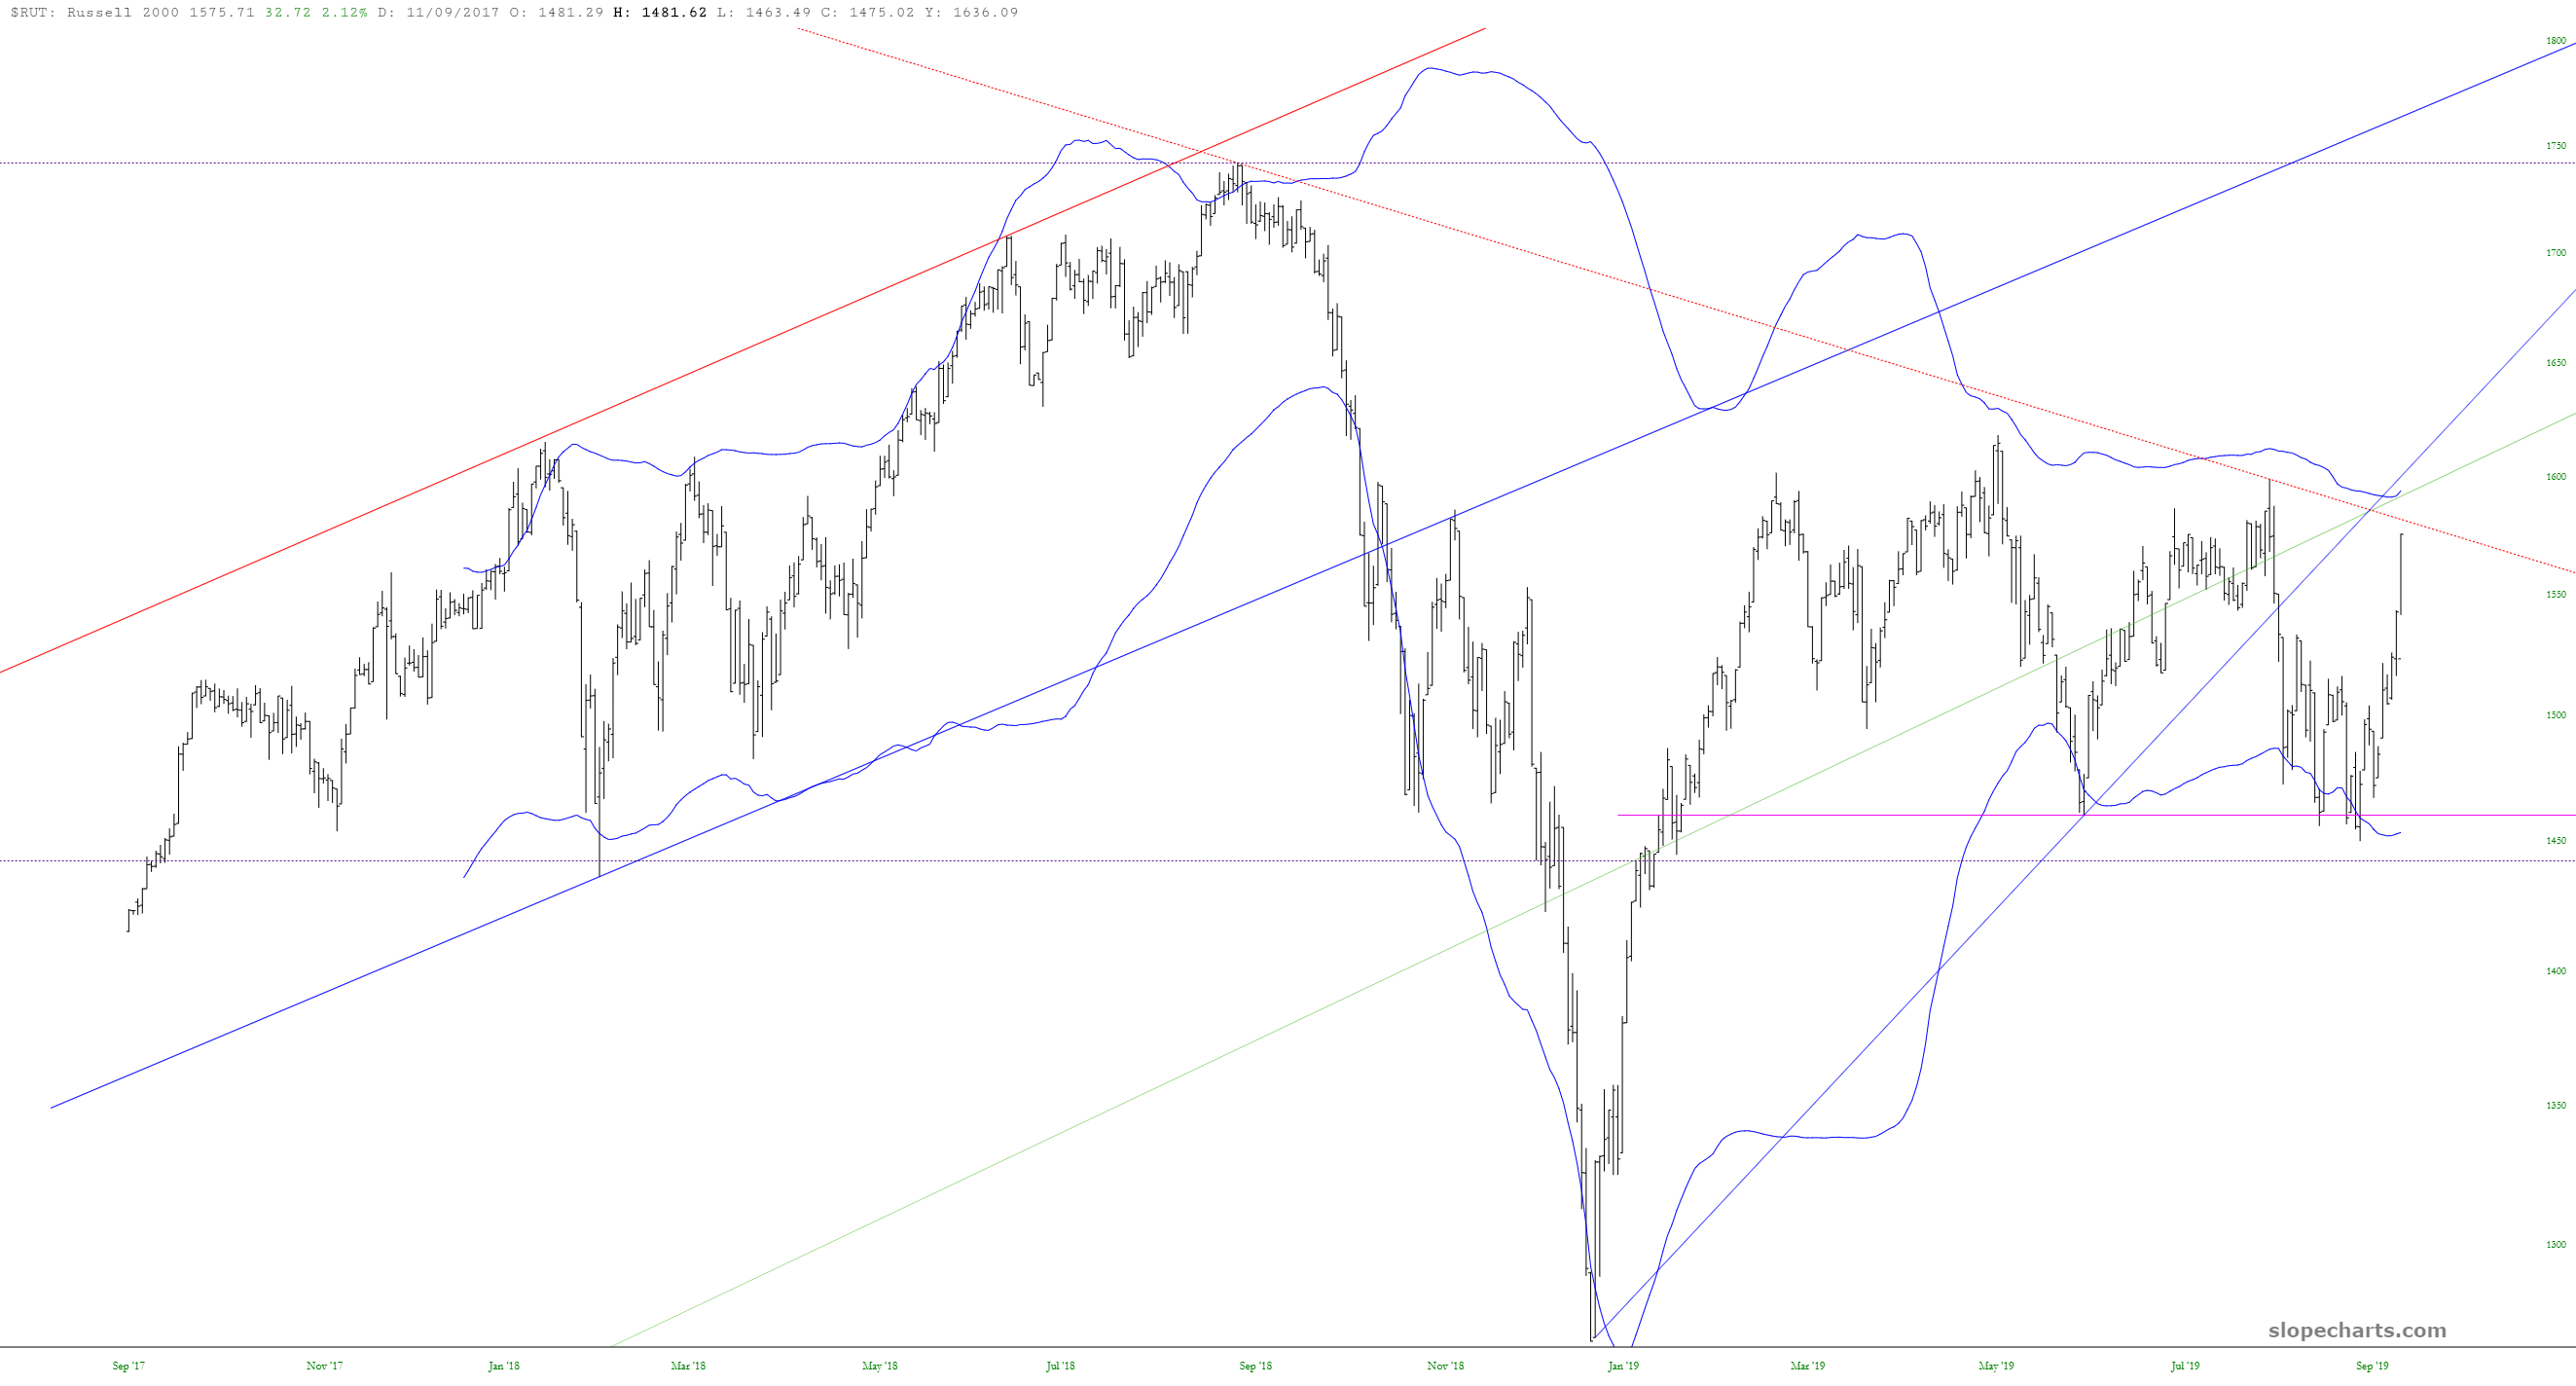
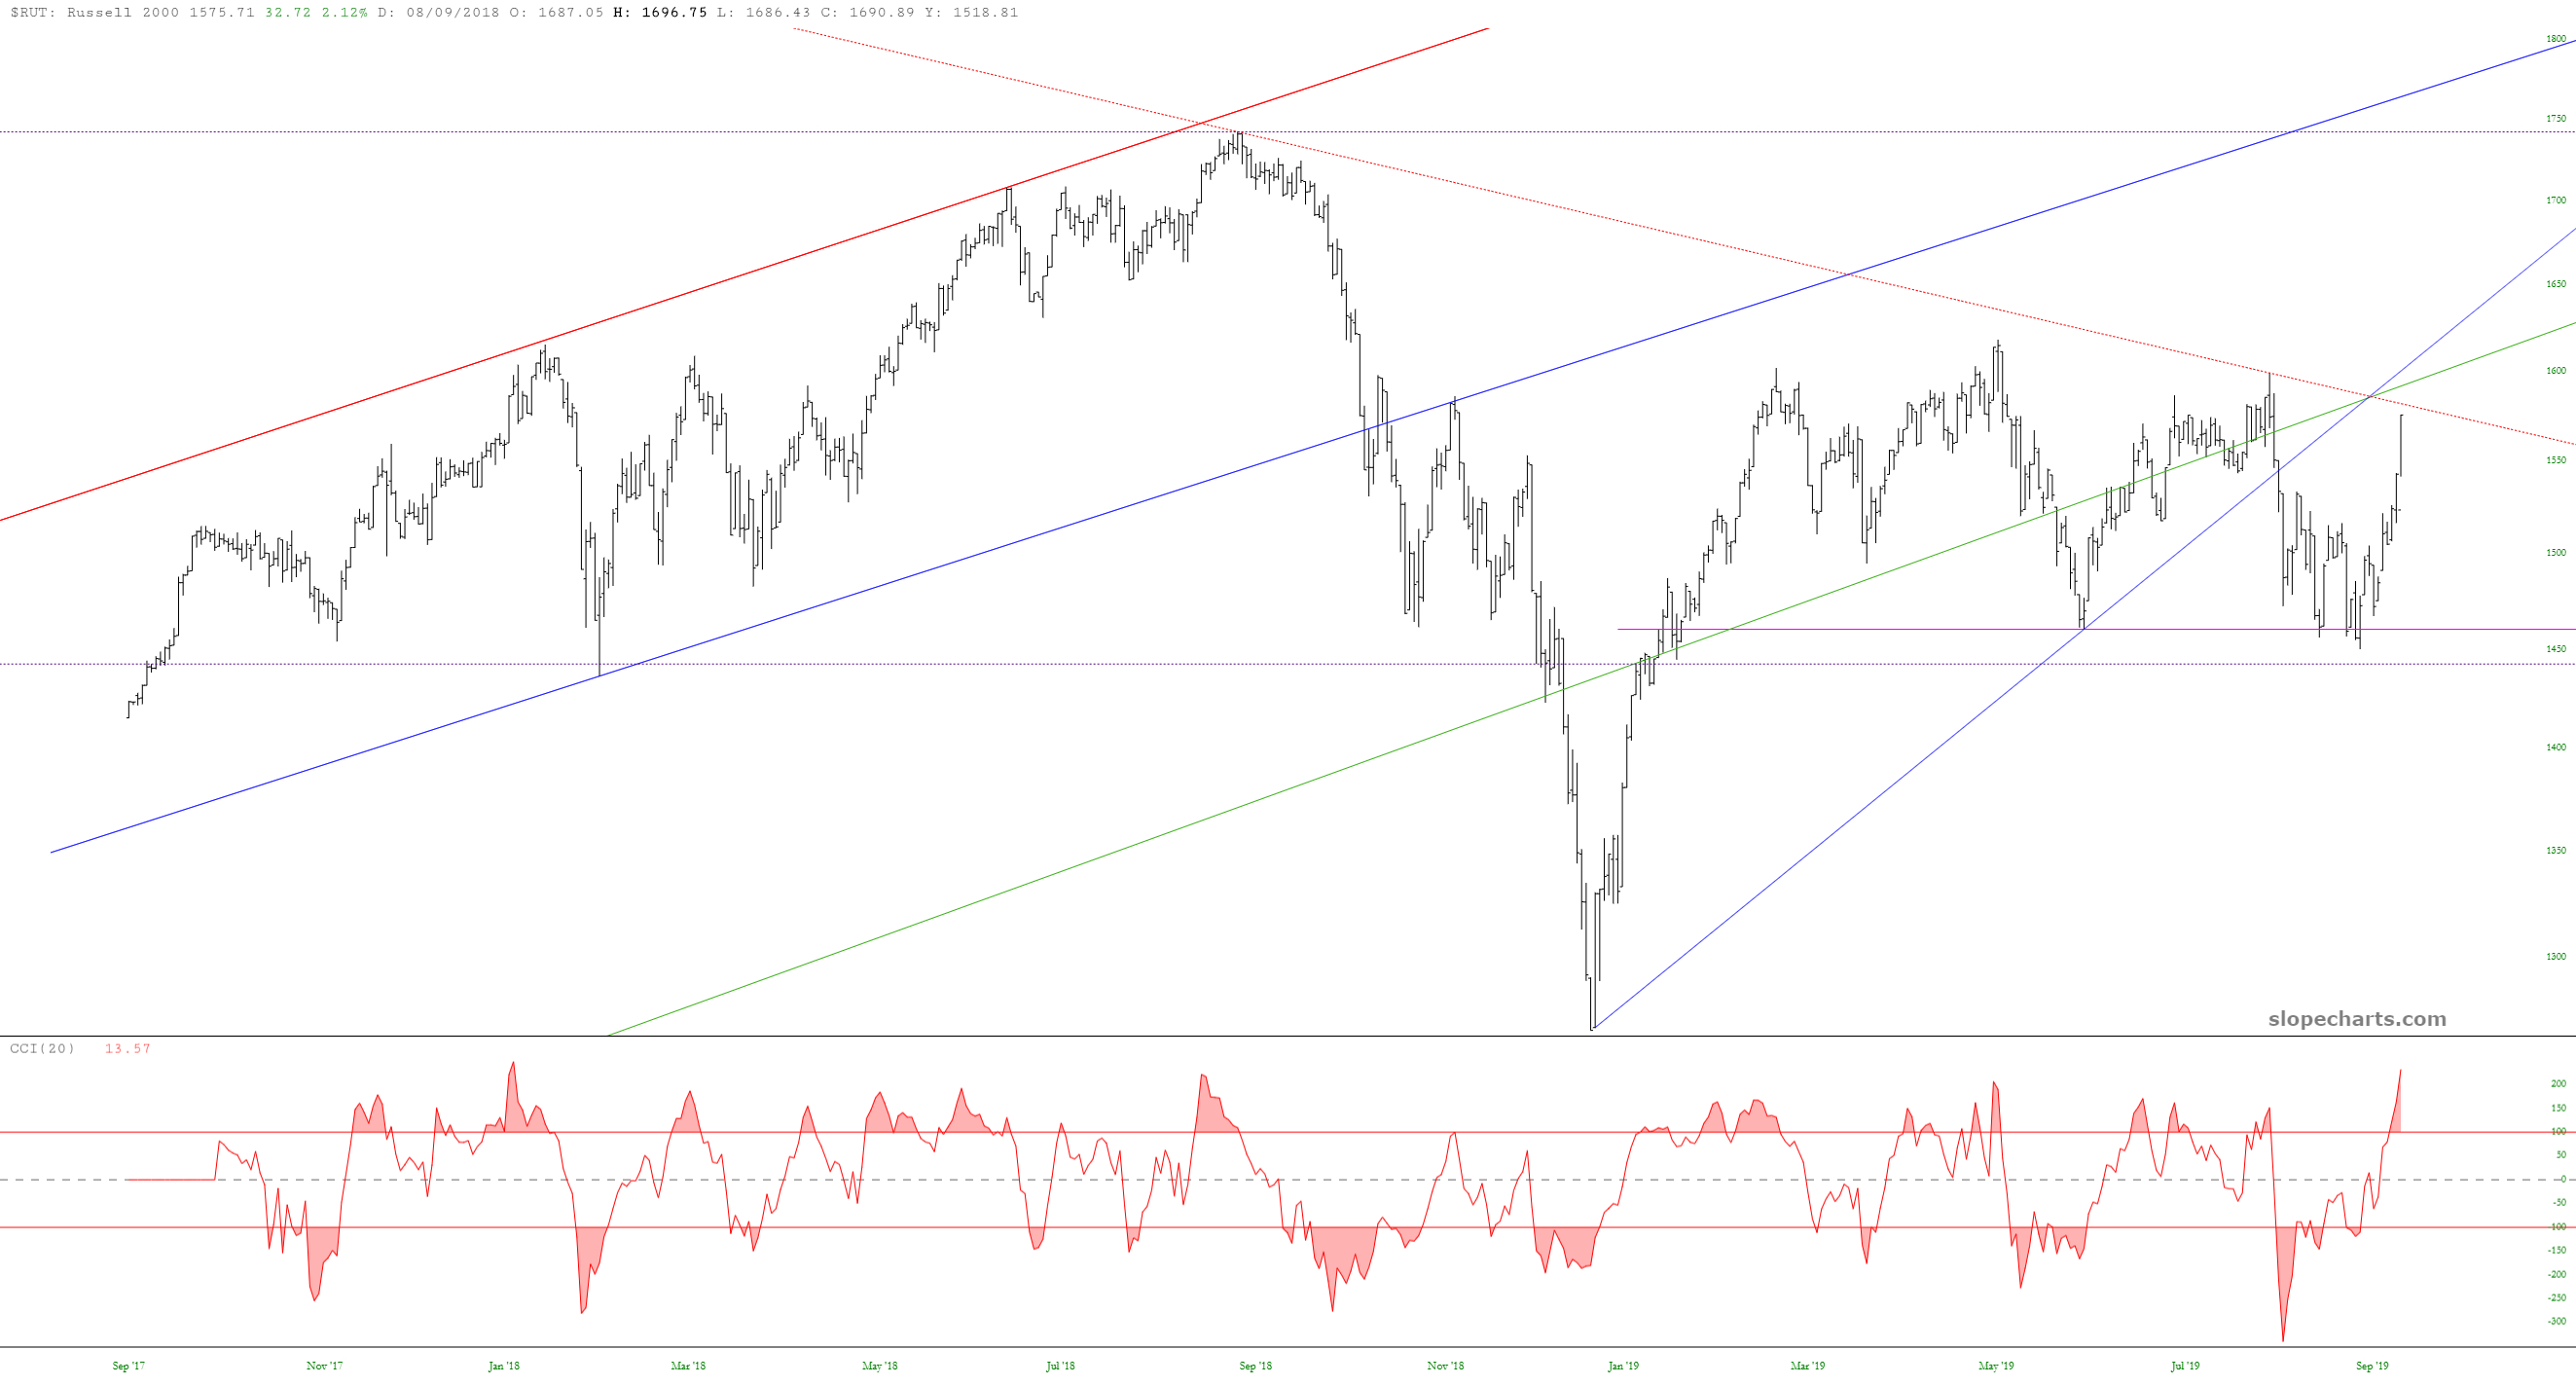
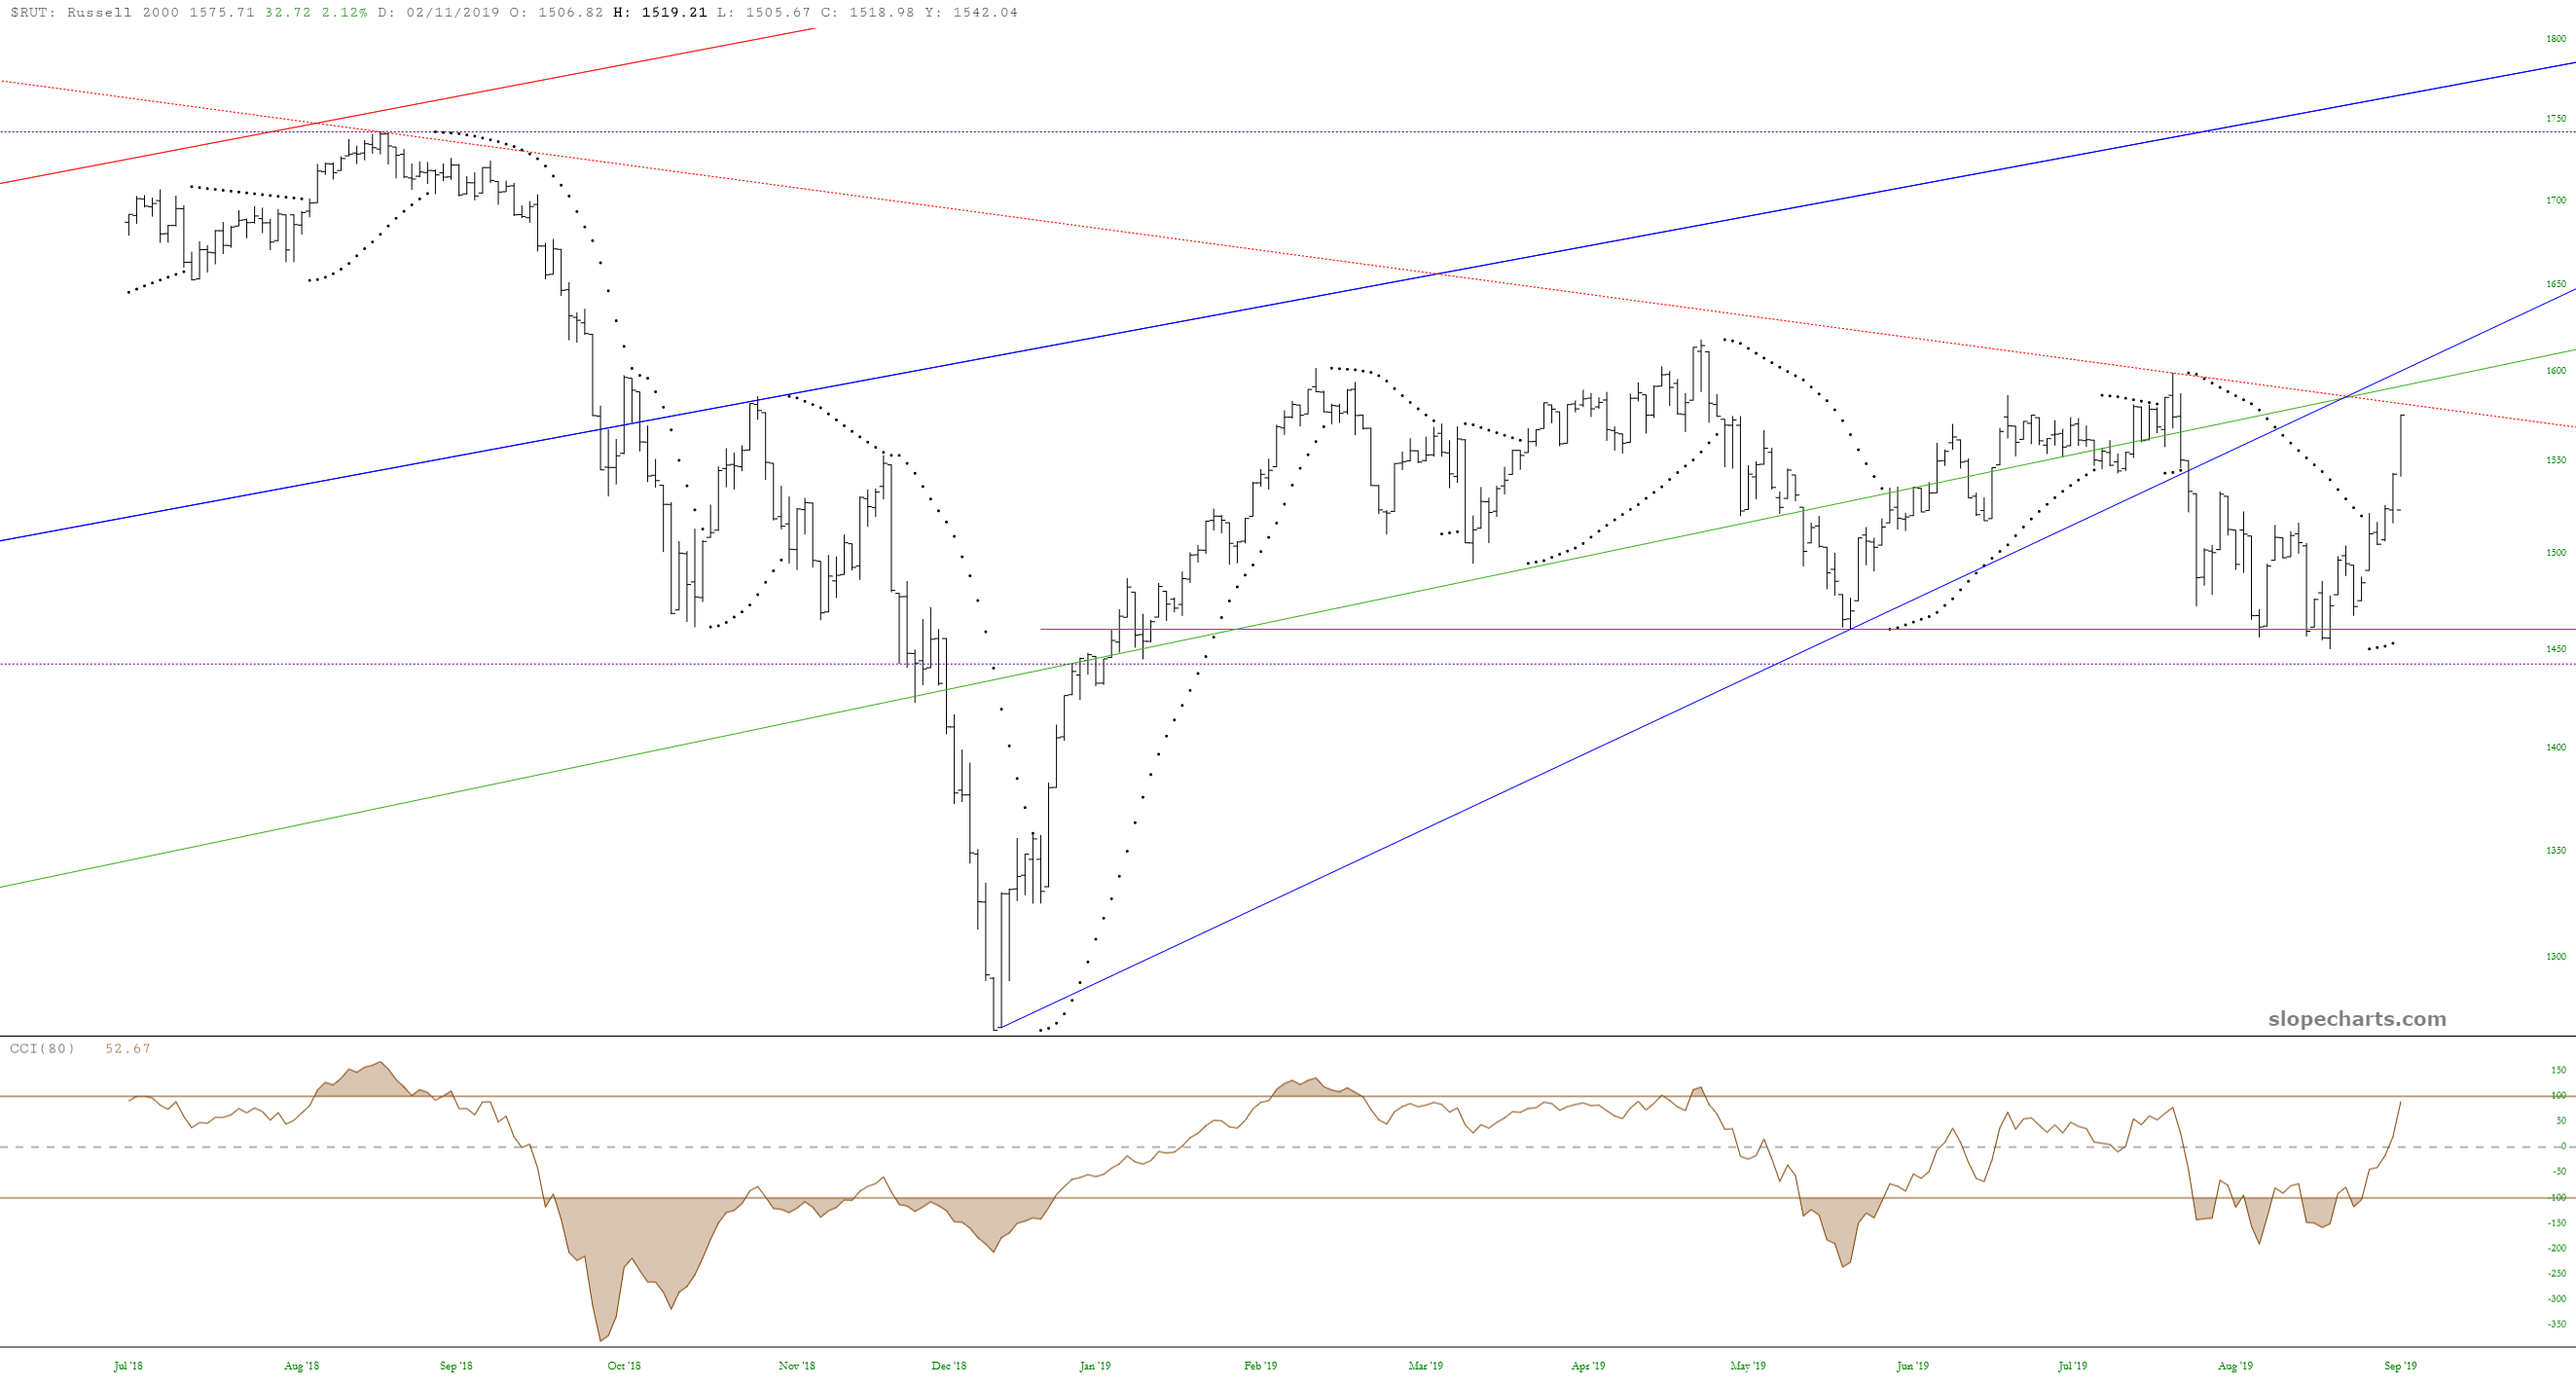
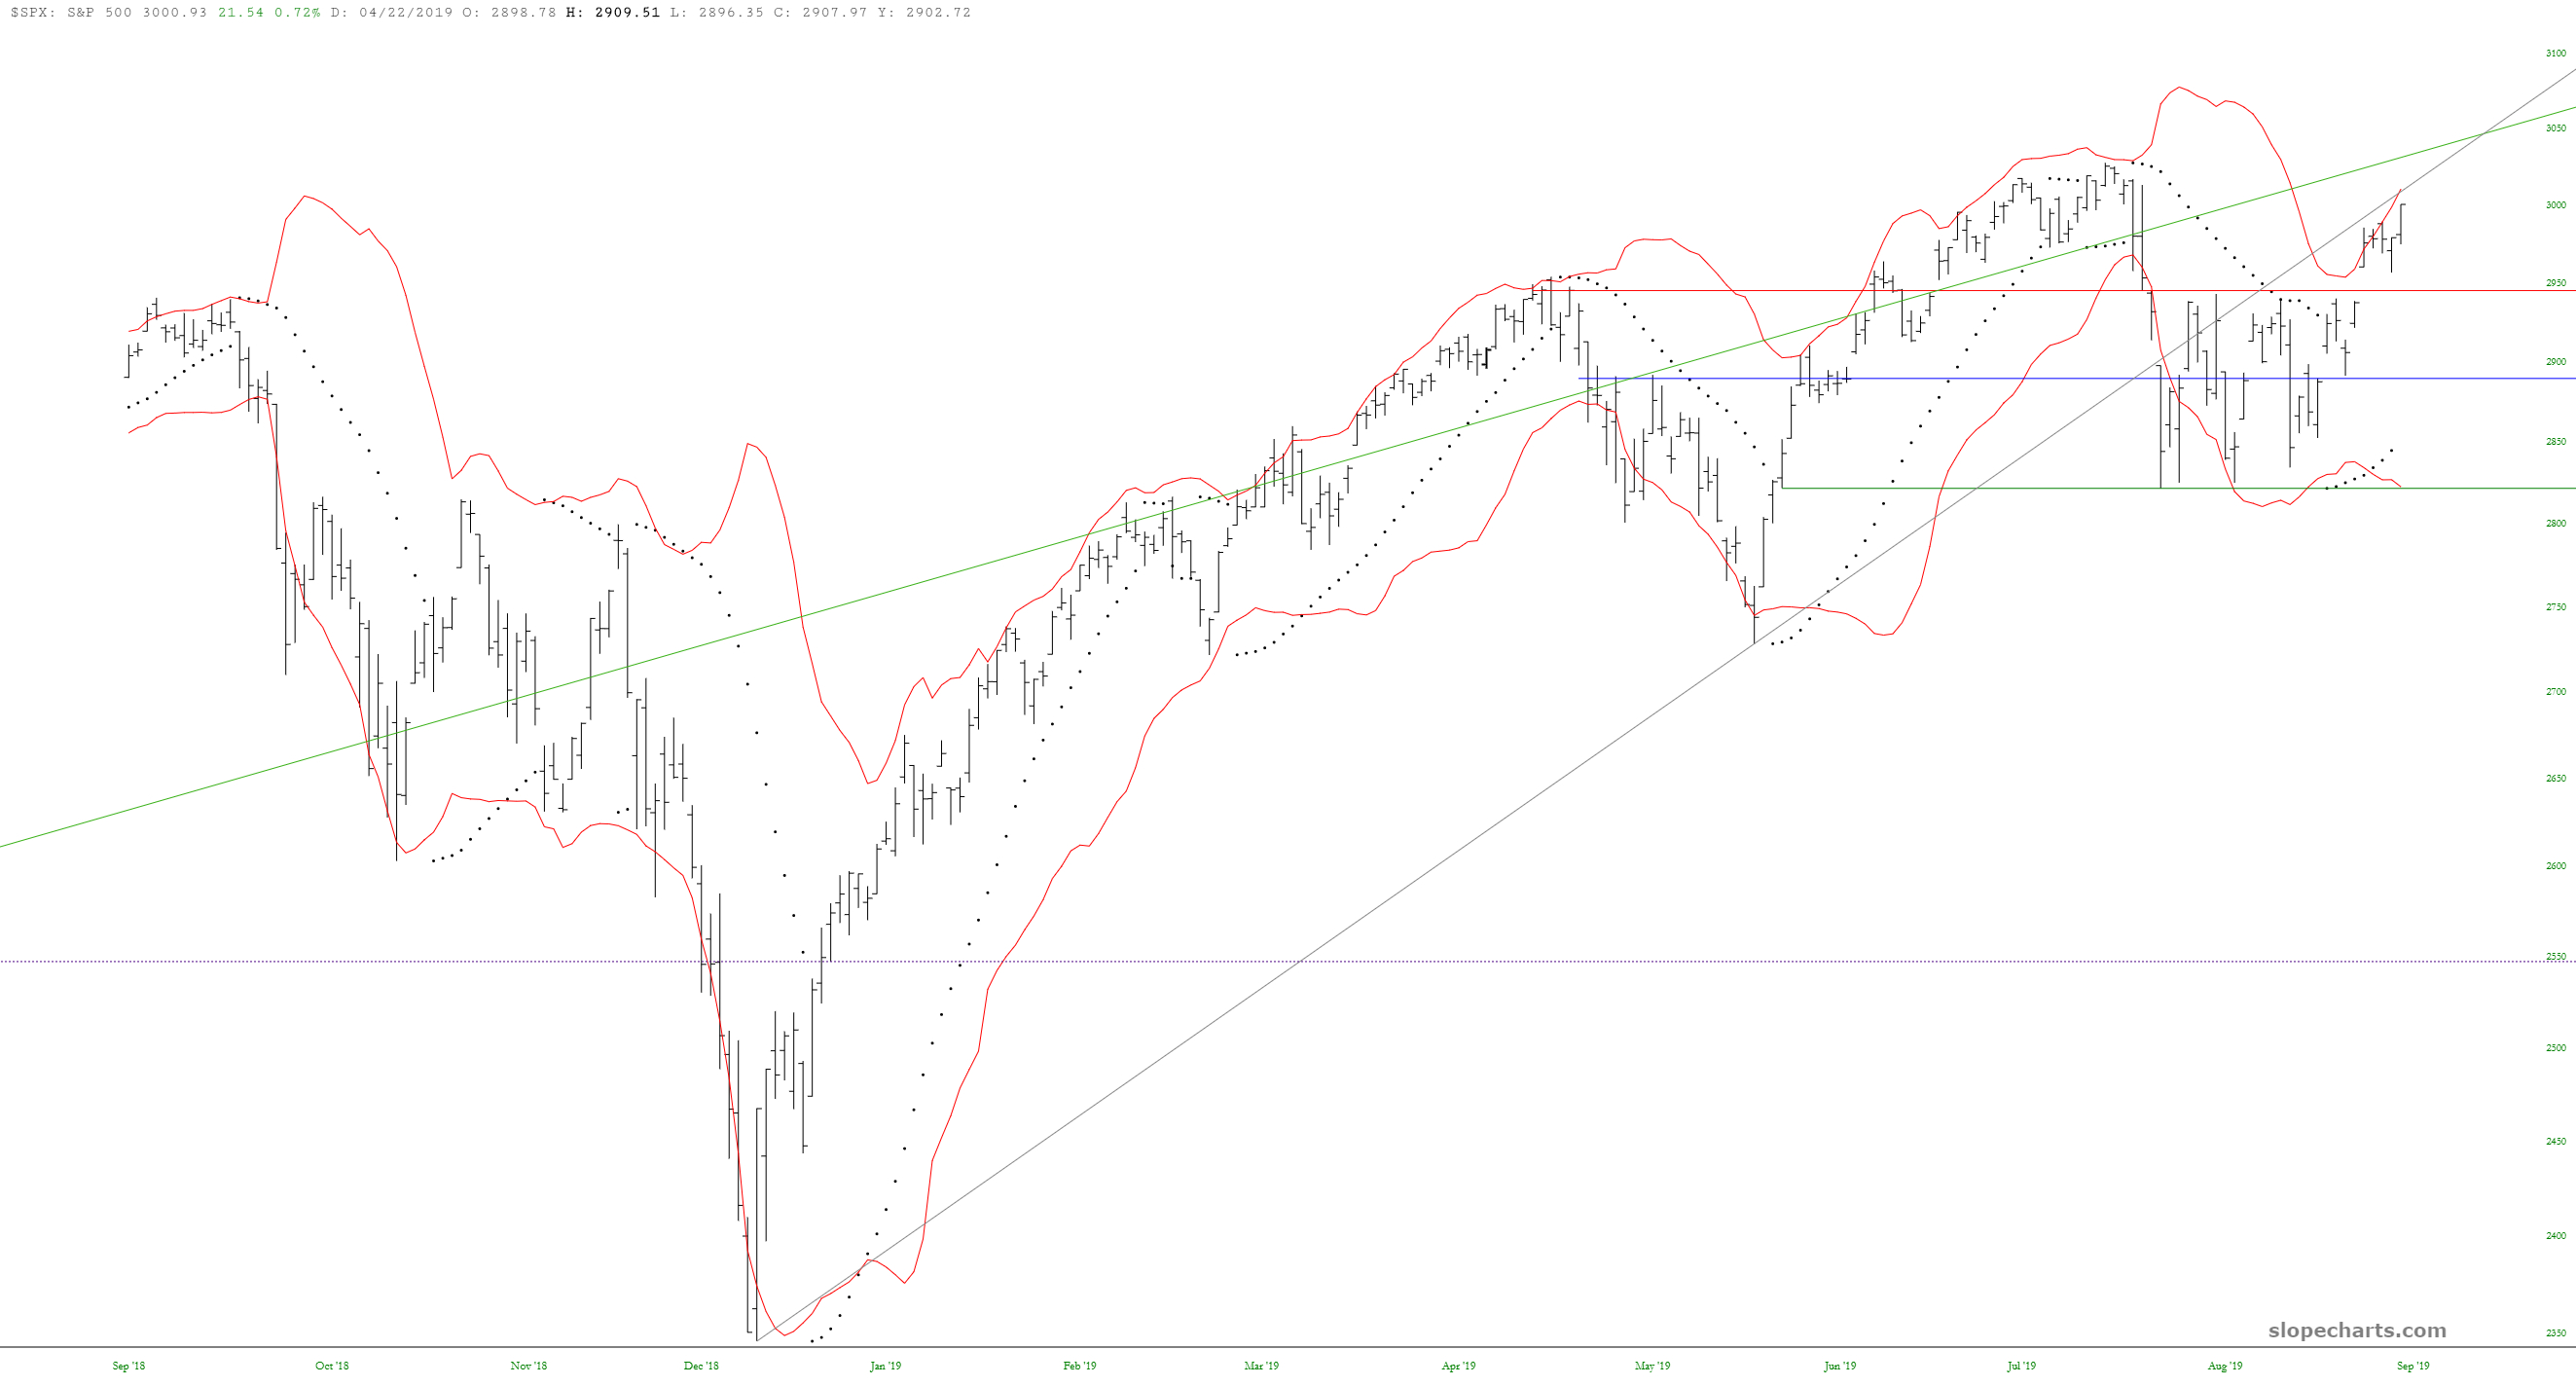
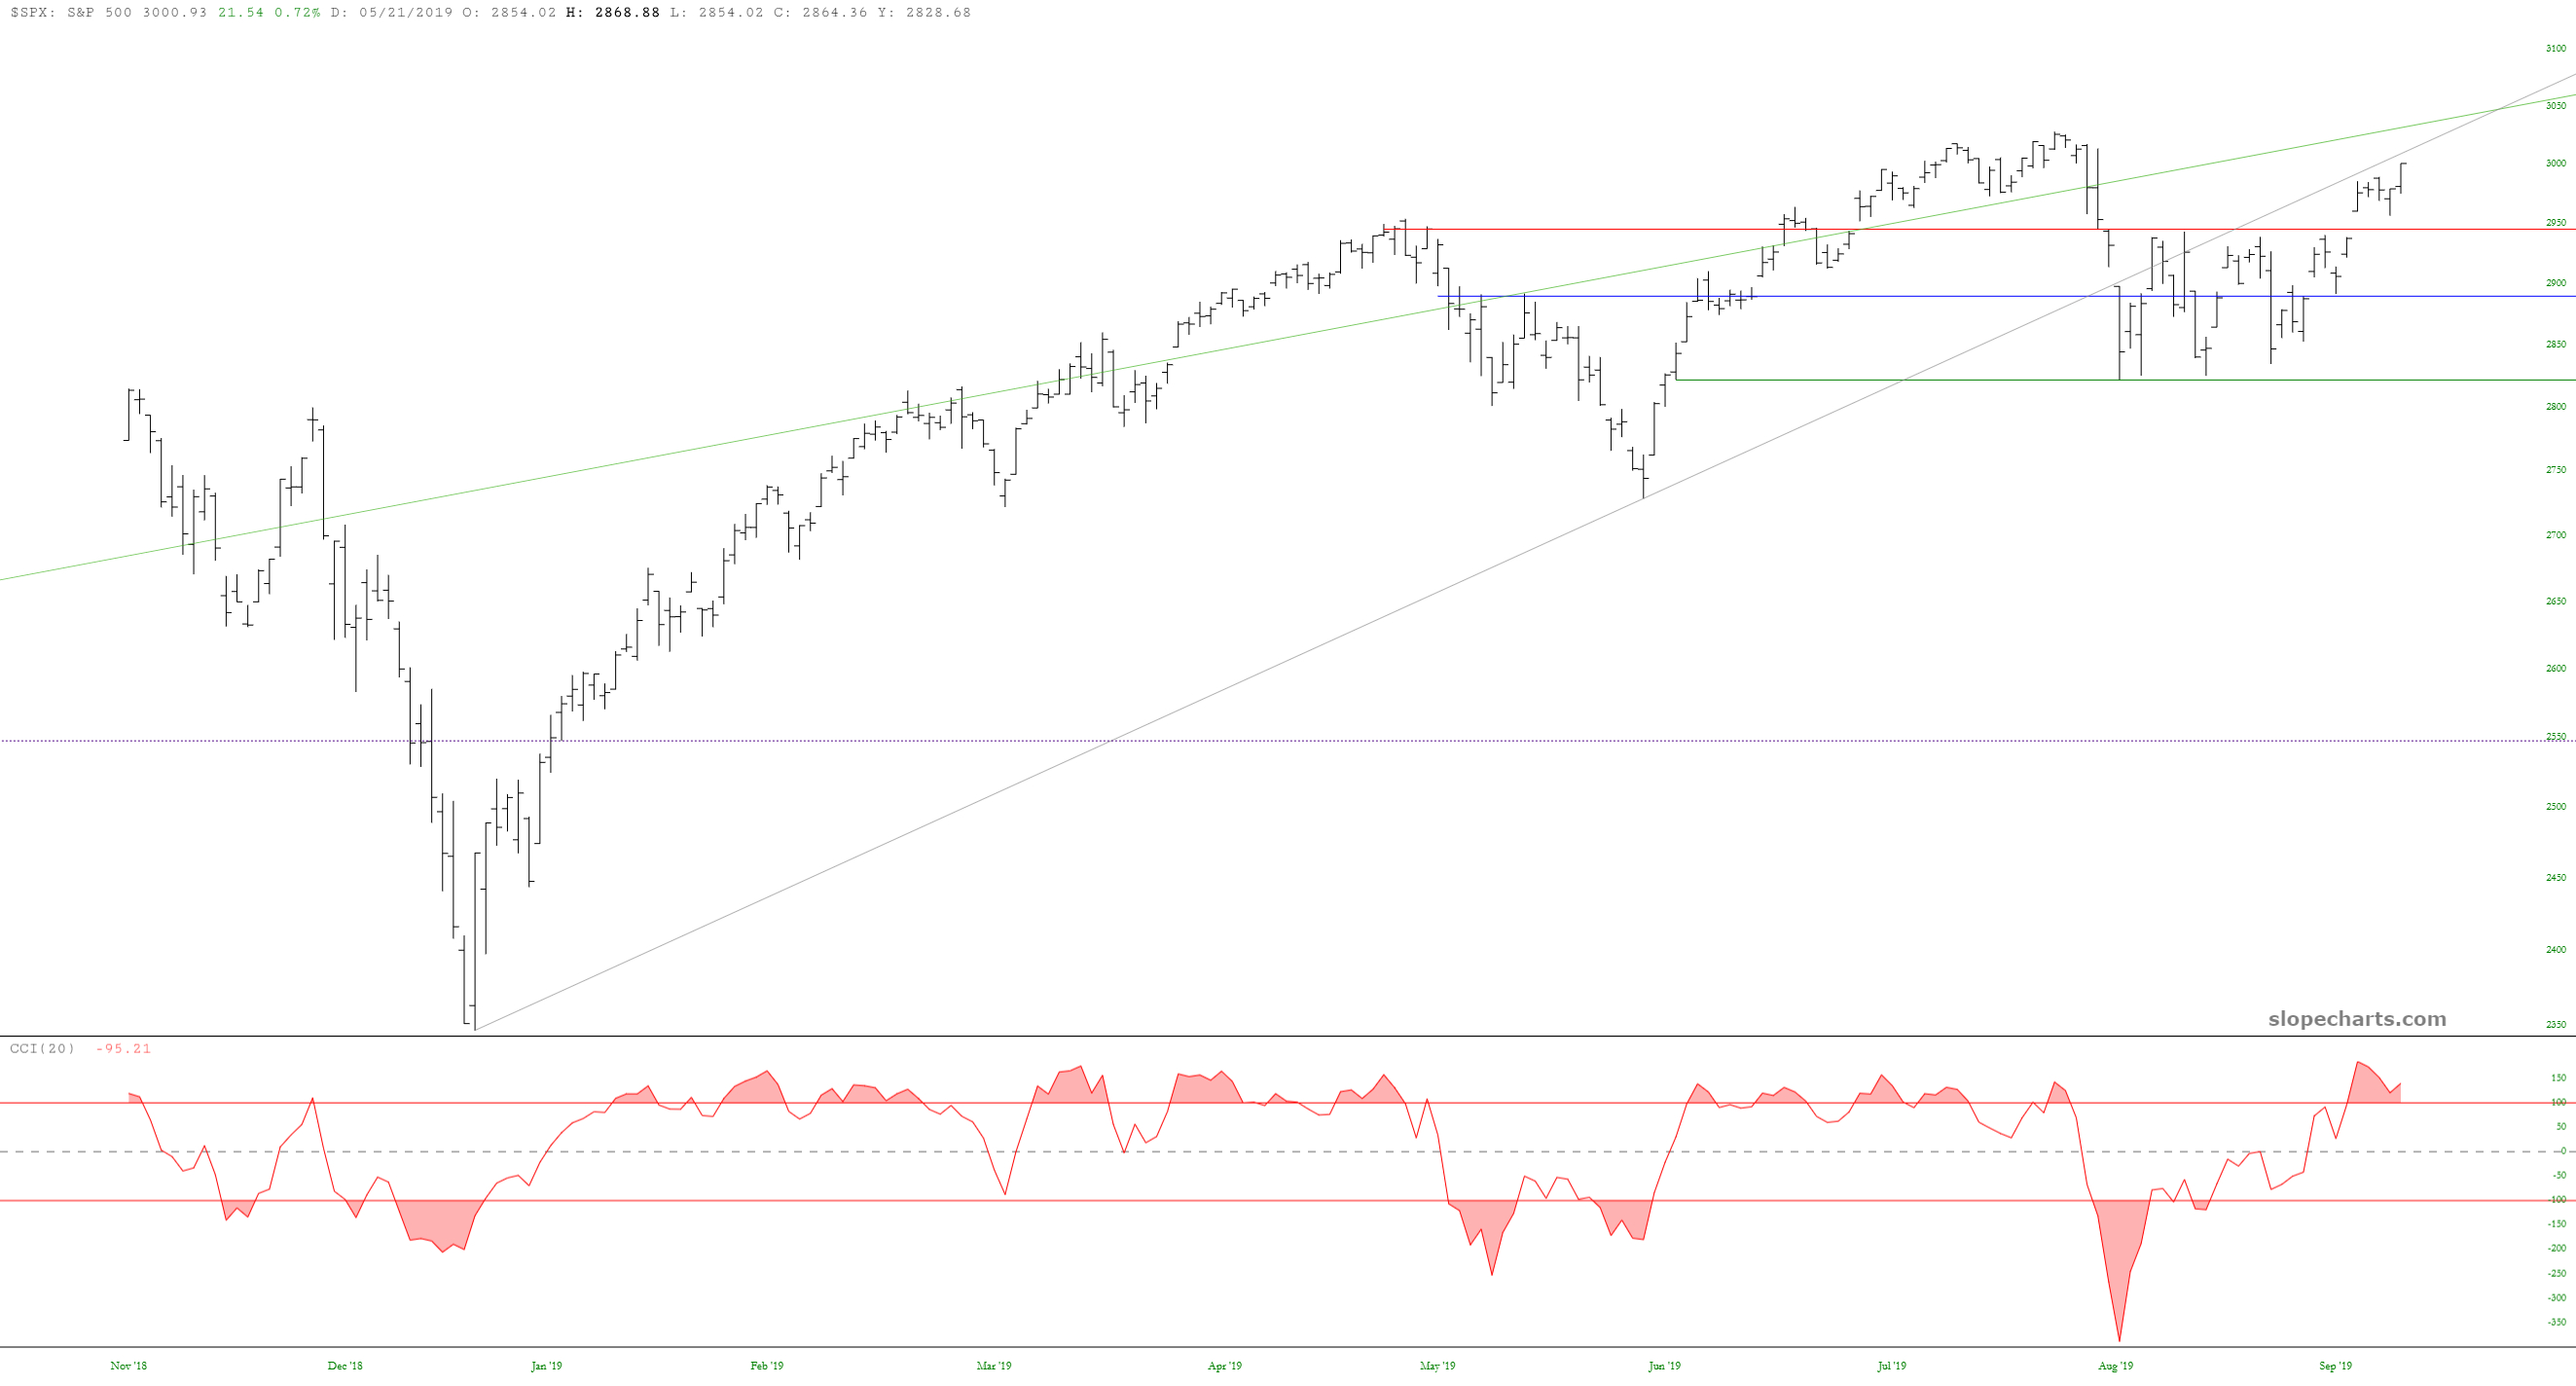
Dow Jones Composite with the slowest possible Bollinger Bands seems quite good for both extremesWilliams %R, again quite slow at 233 days, did a great job nailing the major December bottom, but since then, it’s been stuck in the highest quadrant, so not that useful for recent lowRussell 2000 with slow Bollinger also pretty reliable, especially recentlyRussell with CCI(20) – that is the commodity channel index – seems to be nailing reversals fairly well latelyHere is the Russell with a slower CCI and the PSAR as well (which, to me, lags badly)The S&P 500 with the slow Bollinger wasn’t so good, but with the default setting, it seemed more effective at roughing out reversal zonesS&P with the CCI(20) showed a deeply oversold condition early in August, whereas we are in overbought territory nowUsing a much slower indicator with the S&P 500, it revealed the December bottom quite well, but lately hasn’t broken down from its highest quadrant at all
Not sure that I need to remind anyone, but clicking on a chart will make it super-duper big for easier viewing.