
And so the market started fading on leap day…
On the 1st SPY made a lower high at 137.99 vs the previous day's 138.19.
This much was enough the kick in a downtrend.
ES_H made an almost equal high, shy by only 25 cents vs the leap's 1377.25.
We were closing in on the uptrend line rapidly and ended Friday in a triangle, with the first close below the red trendline.
The triangle being a continuation pattern, the downside was in favor.
I posted this image Sunday night:

The image showed where we would find the SPY should the market open near to where it was.
The importance of this is being outside the triangle is the good old
North Korea vs South Korea image. If you step over the border, we'll shoot you!
And they did. But as all looser gamblers I have not yet managed to come in terms with this reality.
False breaks are false hopes for the most part. Hoping is not trading.
Do not question the price action!
The SPY back tested the broken triangle and finished the day with a lower high again.

So every day there was more damage shaping up.
The turn was on the ES that had stayed inside of its channel all along until Monday that was, when it finally managed to close outside too. At first it tried back in, but didn't say long.
We all know how things fell apart by Tuesday morning. Something like from South South Korea to the Yellow middle earth.
Market makers did their thing by taking the market below prior supports, namely 1350 and even below 1343.
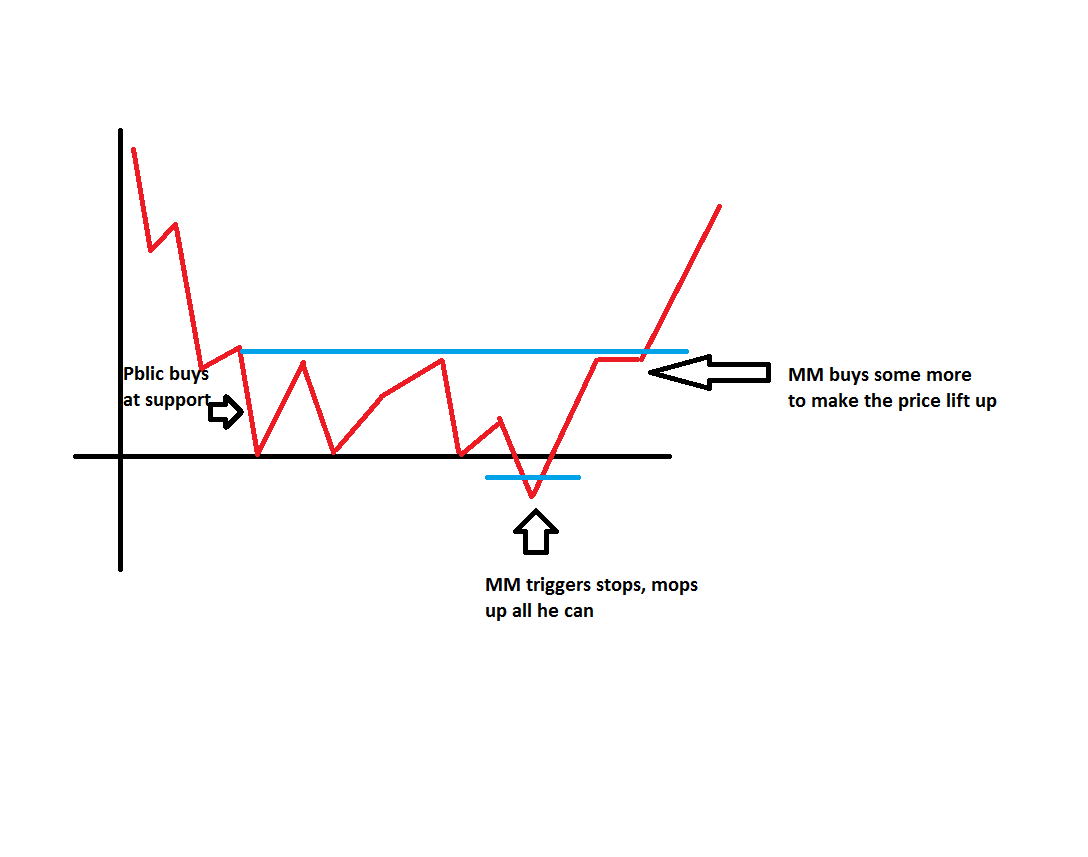

What could have been the clue for a bounce to see?
Oversold Williams R,
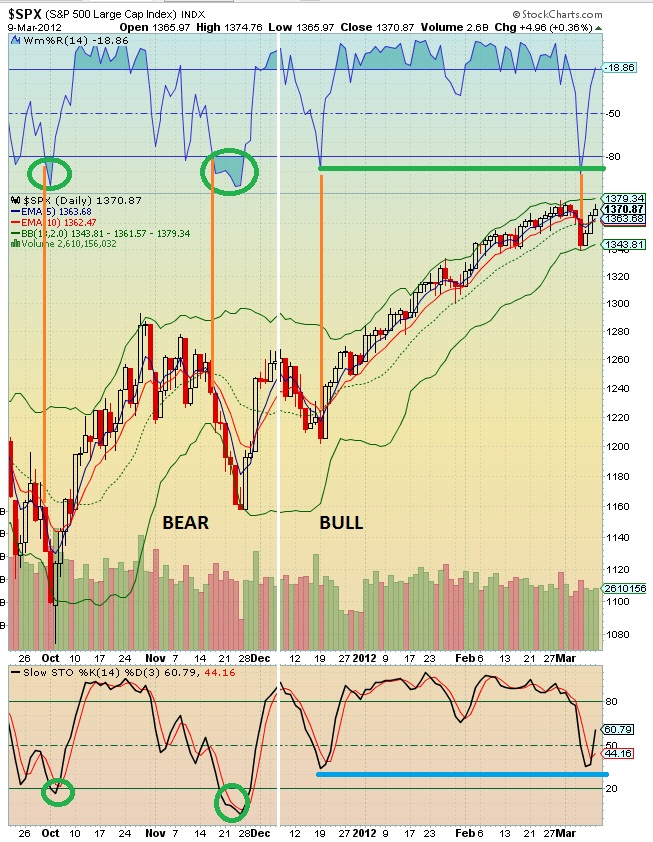
high trin reading and
way oversold NYMO

Not absolutely certain, but there may had been RSI 2 play going on too. If there was they probably sold out on last Friday back at RSI 70+. (Hourly level)
The bounce happened surprisingly slowly, not in 1 or 2, but 3 days.
No new high as expected.
Where are we at? The soft point. ES back testing the broken channel, still in South Korea.

Parabolic tail is one possibility, however I prefer the continued down movement based on low weekly and intra day energy readings.
Going long here doesn't make sense amongst other things because of the recent swing low at 1338.50 (ES_H). And rest assured, if we start exploring downwards, that would not be the last stop.
Ron Walker, who's switching to subscription service as we speak says we saw the highs for the year.
And his Fantastic 4 indicators are all on sell.
