Now that we’ve got the second half of 2025 well underway, let’s catch up with some index charts.
Starting with the NASDSAQ Composite, we were at a lifetime high last Thursday (which was the prior trading day), and we gave up those gains, and a bit more, today. We are presently absolutely spot-on the broken trendline. Make up your mind, tech stocks!

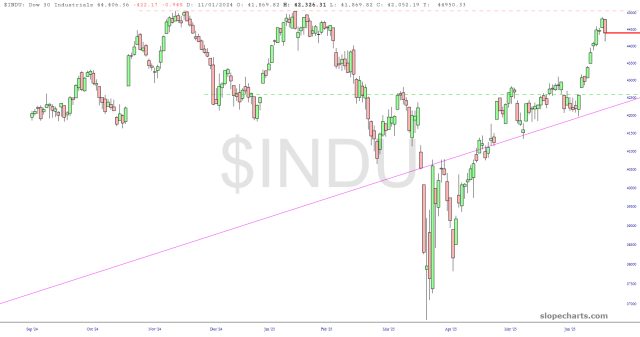
The Dow Industrials were right at the cusp of a new lifetime high Thursday, but they dropped the ball as well. Pretty much across the board, the entirety of Thursday’s jobs report pop is already gone, and in some cases we’re below Thursday.
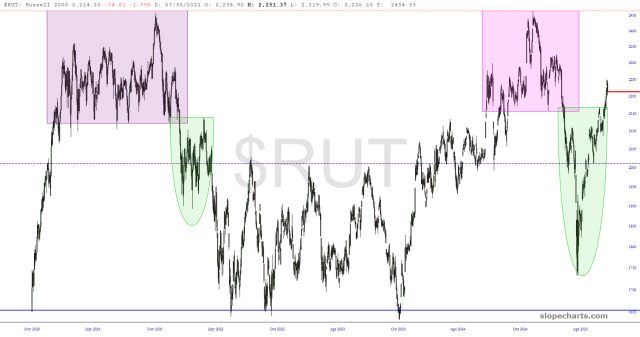
Were it not for the fact that the counter-trend rally on the Russell 2000 has pushed so deeply into “the pink zone”, I would still be pointing to this chart as a powerful analog. As it is now, although ultimately it could hack its way back beneath the Fibonacci, the piercing to the upside has simply been too extreme to consider this analog valid anymore.
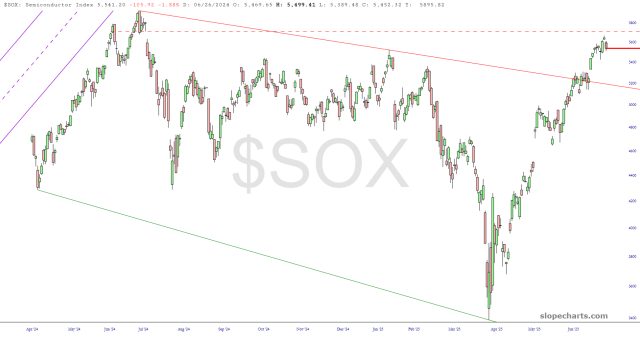
The semiconductor index is a fascinating beat right now. First of all, it had a major price gap (that long horizontal line near the top) that it approached on Thursday yet didn’t manage to seal, and today it gapped down beneath Thursday’s low. This index is basically priced for perfection right now. One big news story could shatter this thing into pieces.
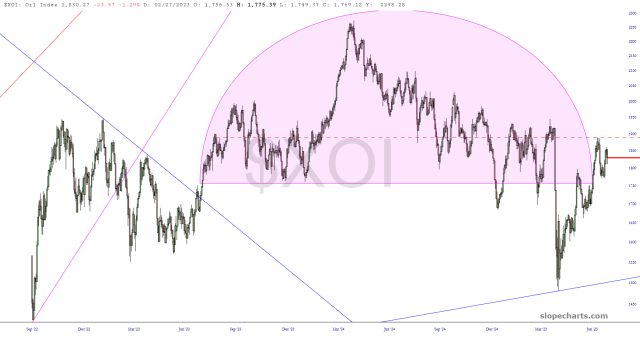
The topping pattern on the oil index remains very sloppy, but prices are clear exhausted now that they’re deep into their own pink zone. This chart could ultimately work out to the downside, but as with so many charts over the past couple of months, there’s simply been too much damage to the formerly pristine pattern to have high confidence.
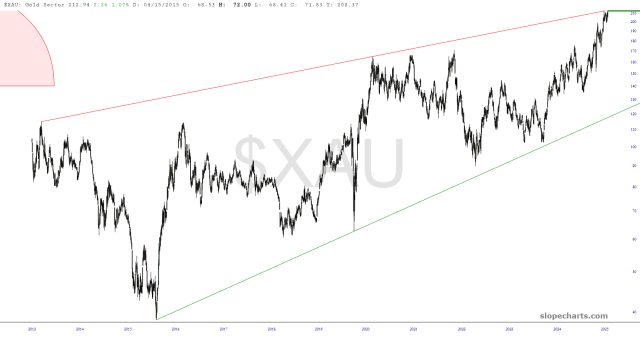
As for the gold sector index, it merits a couple of charts for a closer view. Looking at this long-term chart, you can plainly see that present price levels are very close to where they “should” exhaust themselves, since it is mashed right up against that very long-term resistance trendline.
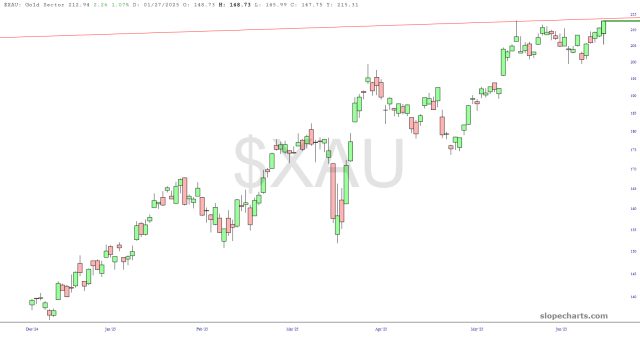
Looking closer, however, it is entirely possible that fiat is so busted, and precious is so well-poised, that prices reach escape velocity from their own long-term history. Let’s see if we get a breakout, which could take place as soon as tomorrow, above this very lengthy contracting pattern.
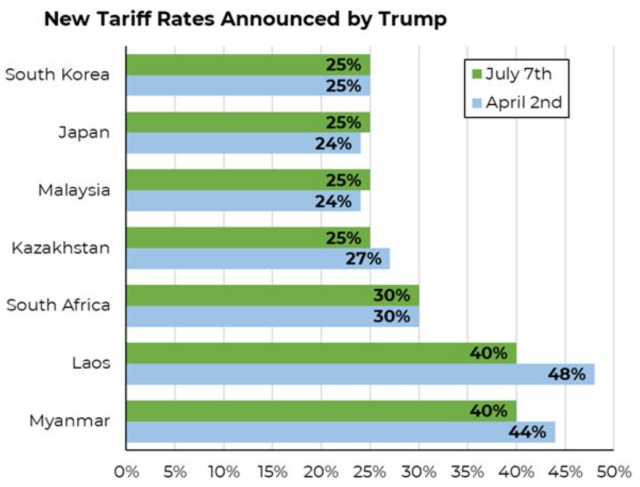
What’s remarkable to me is that the tariff rates announced today are virtually identical to the same tariffs for the same countries back on April 2nd, when all holy hell broke loose. And yet the market seems very comfortable being over one thousand points higher on the S&P with the same set of facts!