
Hey fellow Slopers,
A number that stood out when compiling the data for this post was the current cost of hedging the first gold ETF, GLD. Back in August, the cost of hedging it against a greater-than-20% drop over approximately the next 7 months was less than 0.95%; as of Monday, it was nearly 2.5%. The table below shows that, as well as the costs, as of Monday's close, of hedging several other commodity ETFs against greater-than-20% declines over the next several months, using optimal puts.
Comparisons
For the individual oil ETFs, I added the PowersShares DB Energy ETF (DBE) as a comparison, and for the individual agricultural commodity ETFs I added PowerShares DB Agriculture (DBA) as a comparison. First, a reminder about what optimal puts are, and why I've used 20% as a decline threshold; then, a screen capture showing the current optimal puts to hedge the comparison agricultural commodity ETF, DBA.
About Optimal Puts
Optimal puts are the ones that will give you the level of protection you want at the lowest possible cost. Portfolio Armor (available on the web and as an Apple iOS app), uses an algorithm developed by a finance Ph.D to sort through and analyze all of the available puts for your stocks and ETFs, scanning for the optimal ones.
Decline Thresholds
In this context, "threshold" is the maximum decline you are willing to risk in the value of your position. You can enter any percentage you like for a decline threshold when scanning for optimal puts (the higher the percentage though, the greater the chance you will find optimal puts for your position). You can enter any percentage you like for a decline threshold when scanning for optimal puts (the higher the percentage though, the greater the chance you will find optimal puts for your position). I have used 20% thresholds for each of the securities below. Essentially, 20% is a large enough threshold that it reduces the cost of hedging, but not so large that it precludes a recovery.
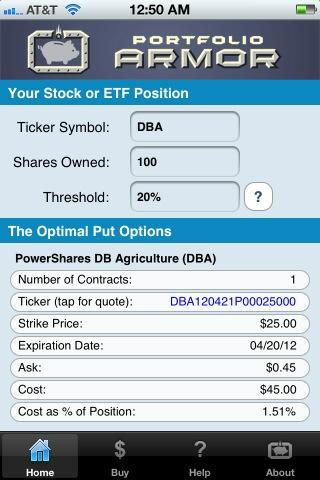
The optimal puts for DBA
Below is a screen capture showing the optimal put option contract to buy to hedge 100 shares of DBA gainst a greater-than-20% drop between now and April 20, 2012. A note about these optimal put options and their cost: to be conservative, Portfolio Armor calculated the cost based on the ask price of the optimal puts. In practice an investor can often purchase puts for a lower price, i.e., some price between the bid and the ask.
Hedging Costs as of Monday's Close
|
Symbol |
Name |
Cost of Protecting against >20% Decline, as % of position |
|
Oil |
||
|
OIL |
iPath S&P GSCI Cruide Oil |
13.6%*** |
|
USO |
United States Oil |
5.68%* |
|
USL |
United States 12 Month Oil |
11.2%* |
| DBO | PowerShares DB Oil | 5.19%* |
| BNO | United States Brent Oil | 4.42%* |
| Energy |
||
| DBE | PowersShares DB Energy | 3.16%* |
| Corn |
||
| CORN | Teucrium Corn | 5.64%** |
| Livestock | ||
| COW | iPath DJ-UBS Livestock | 2.12%* |
| Agriculture | ||
| DBA | PowerShares DB Agriculture | 1.51%* |
|
Gold |
||
|
GLD |
SPDR Gold Trust |
2.42%*** |
| IAU | iShares Gold Trust | 2.59%* |
*Based on optimal puts expiring in April, 2012.
**Based on optimal puts expiring in May, 2012.
***Based on optimal puts expiring in June, 2012
