I look at fifty-seven ETF charts every weekday, but here are the eight I think are most worth noting right now.
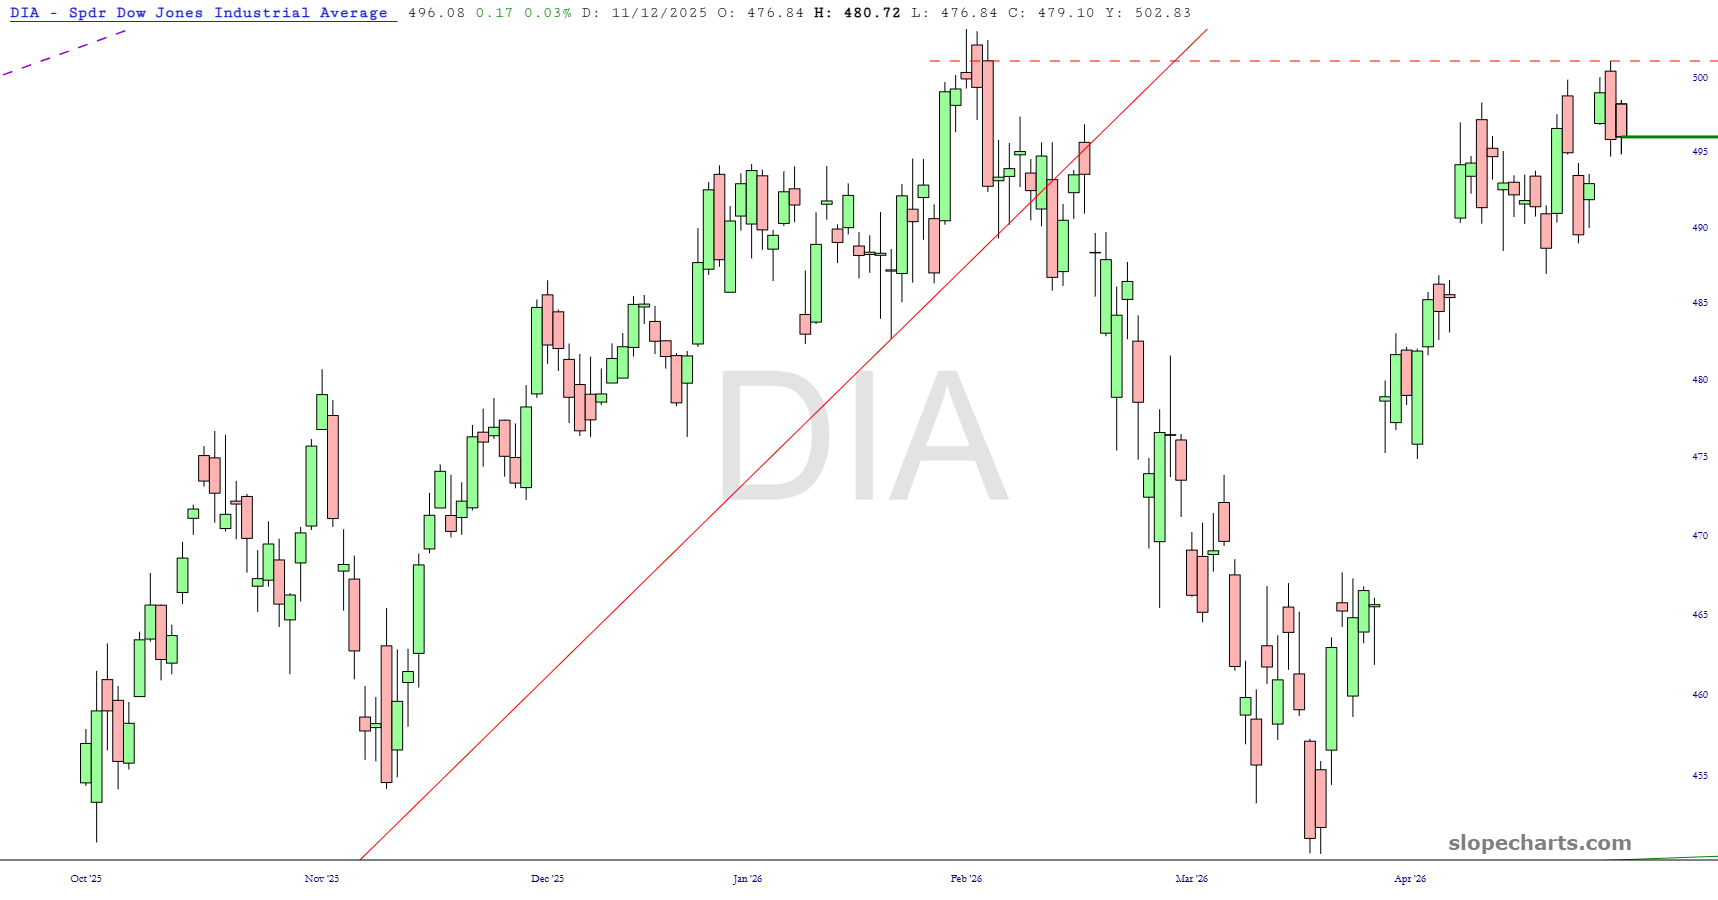
First up is the one for the Dow Industrials, which was effectively unchanged on Friday (in sharp contrast to everything else, which raged to lifetime highs). Key resistance right now is at Thursday’s high.
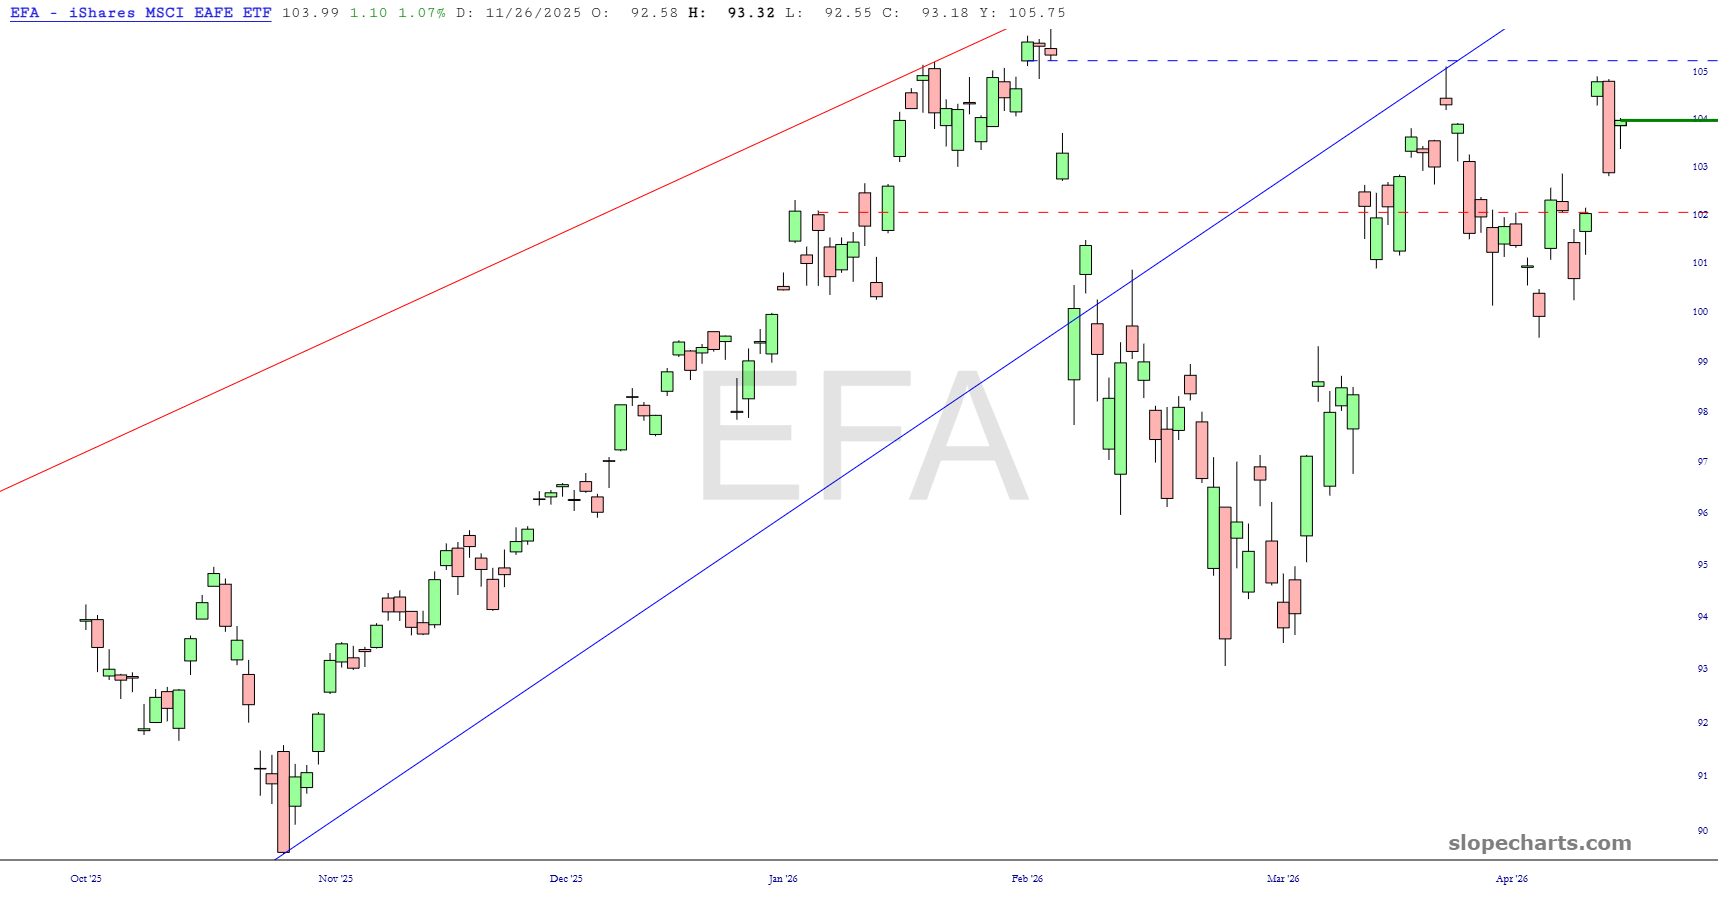
The worldwide futures (outside North America) lost a lot of ground on Thursday and partly made it up on Friday. The price gap shown with the dashed line is principal resistance now.
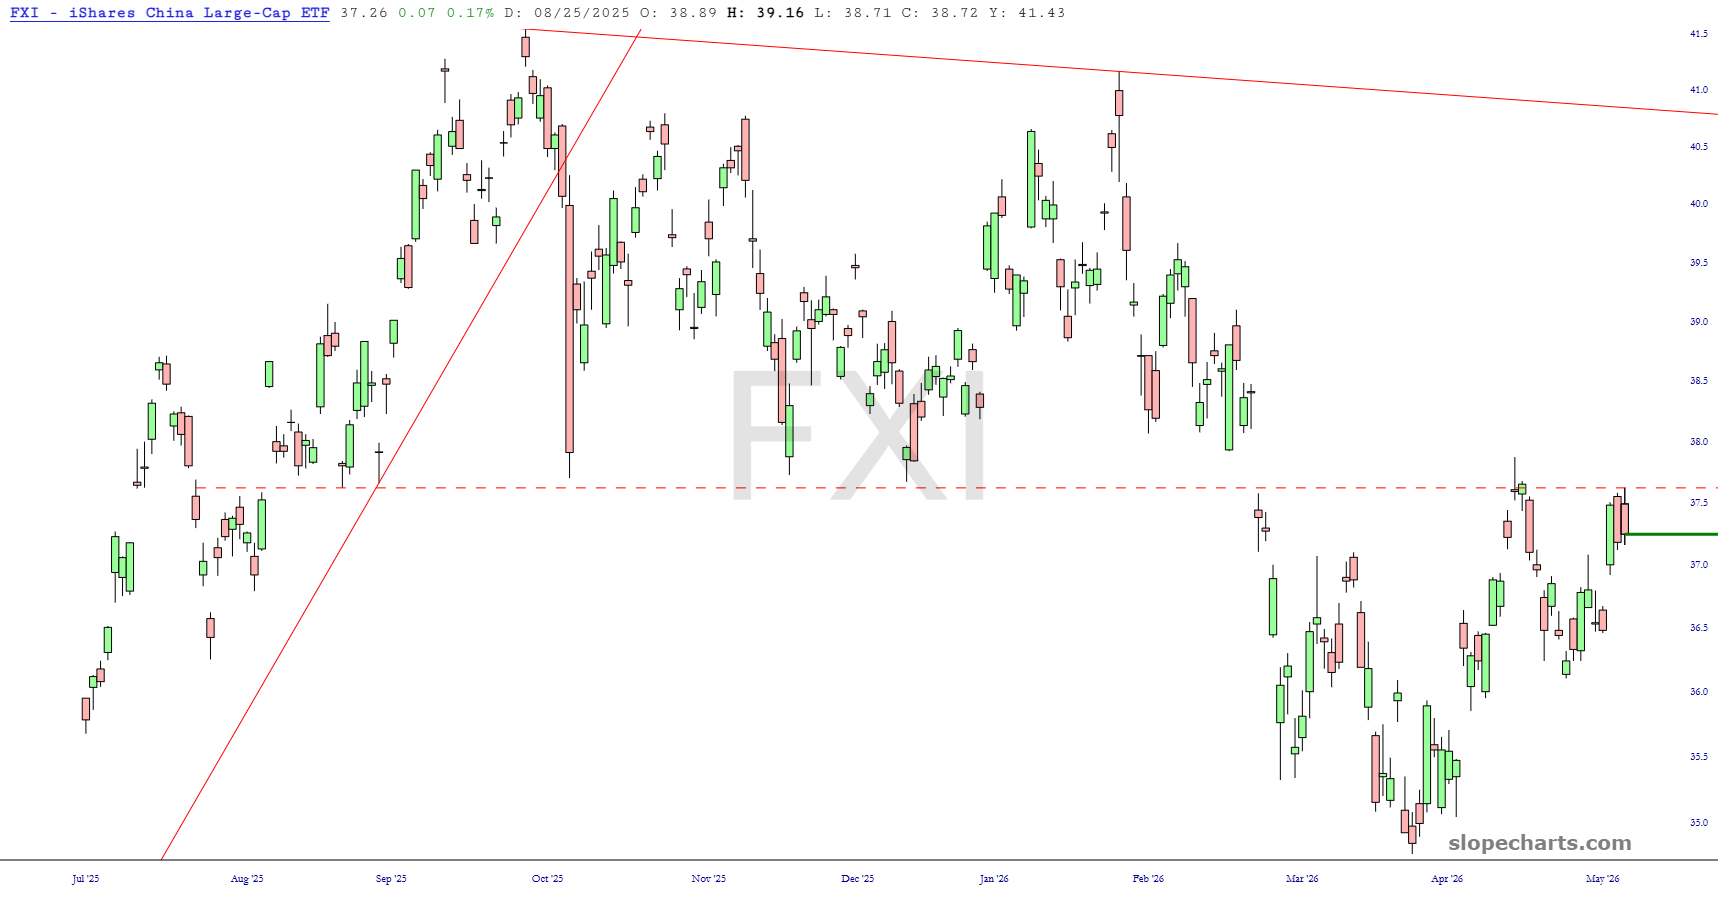
More specifically, China is sporting a well-formed right triangle top, and resistance is holding well.
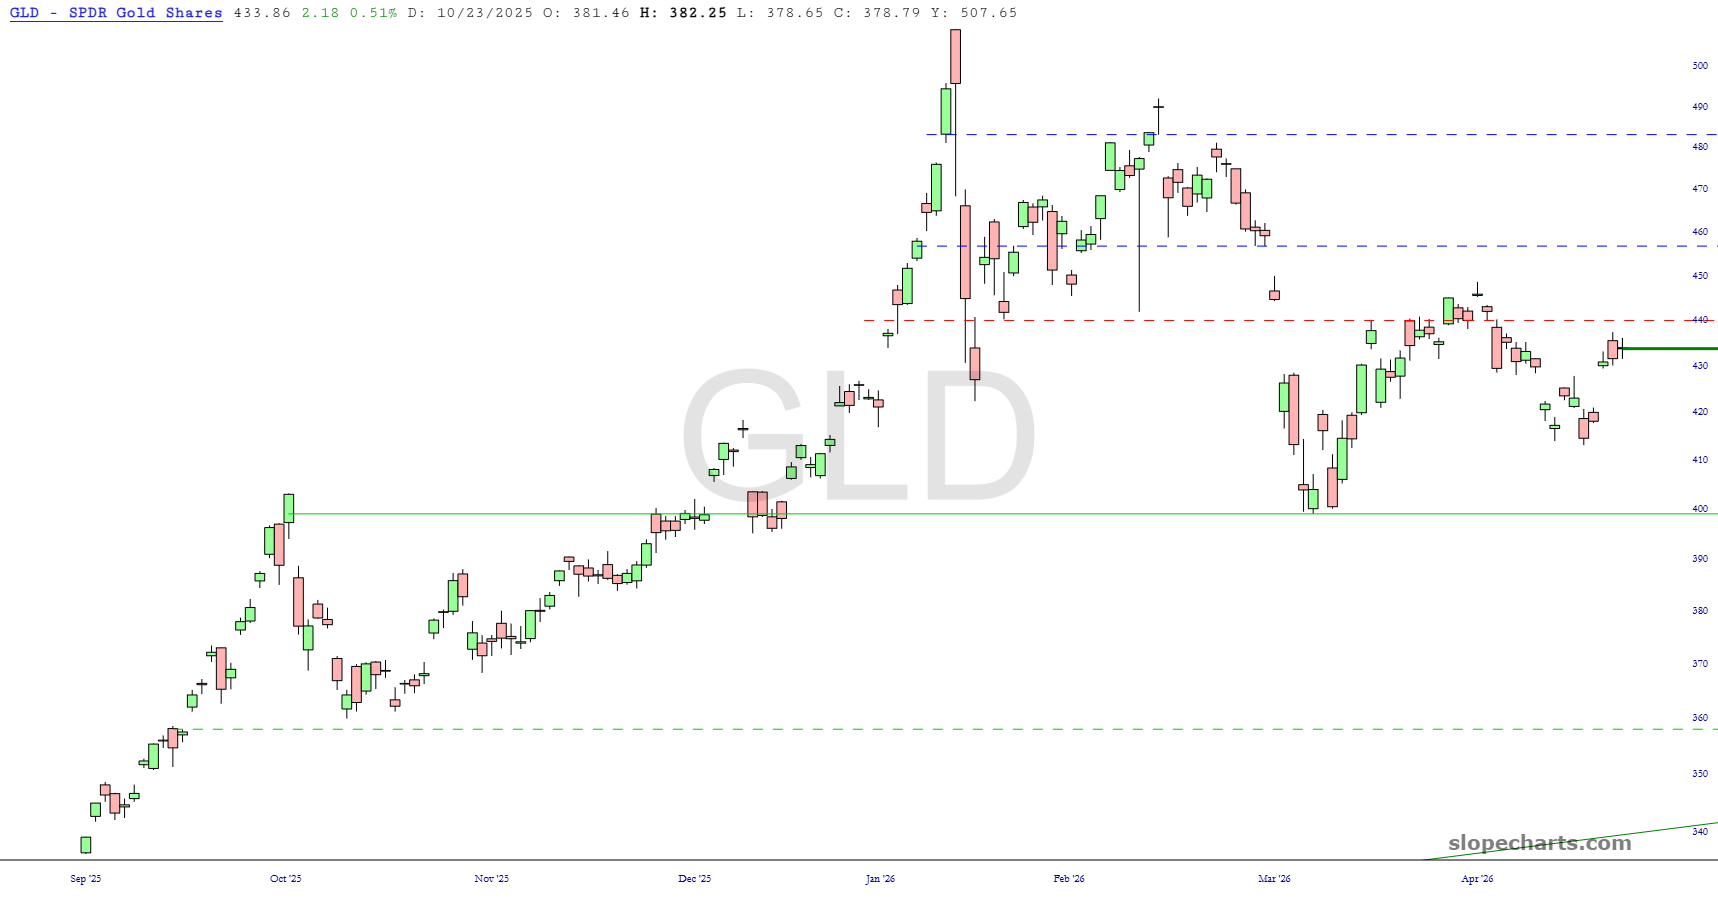
Gold likewise is respecting its price gap, and the resistance is shown with the dashed horizontal line. Incidentally, lest any of you need reminding, you can get a bigger chart by clicking on it.
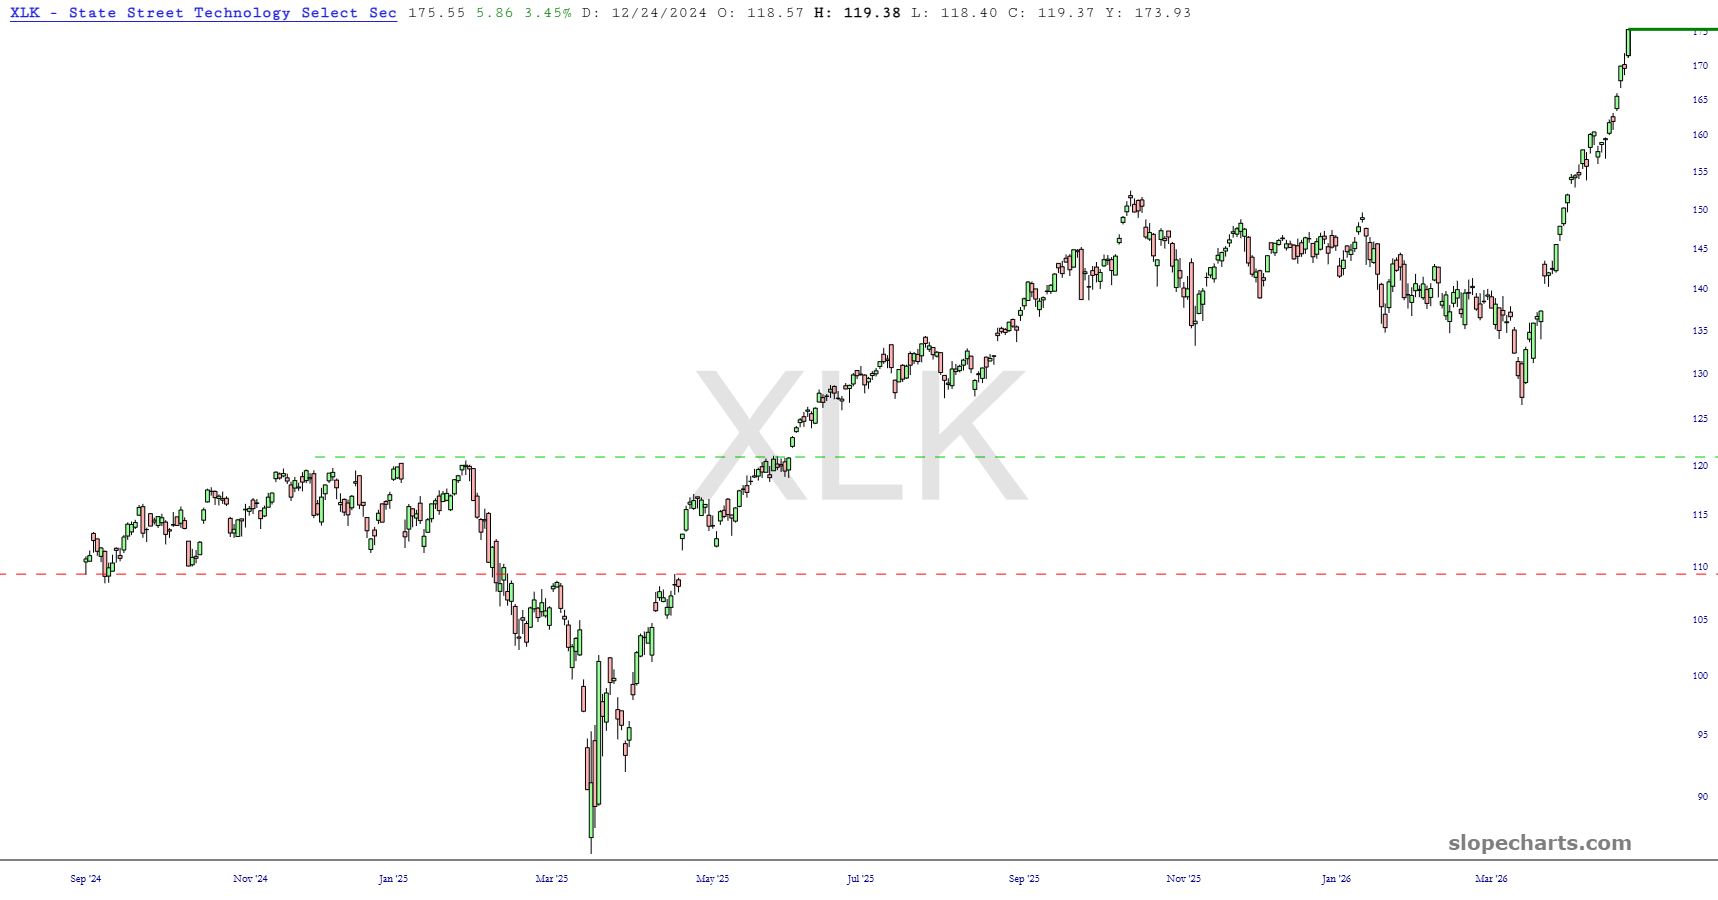
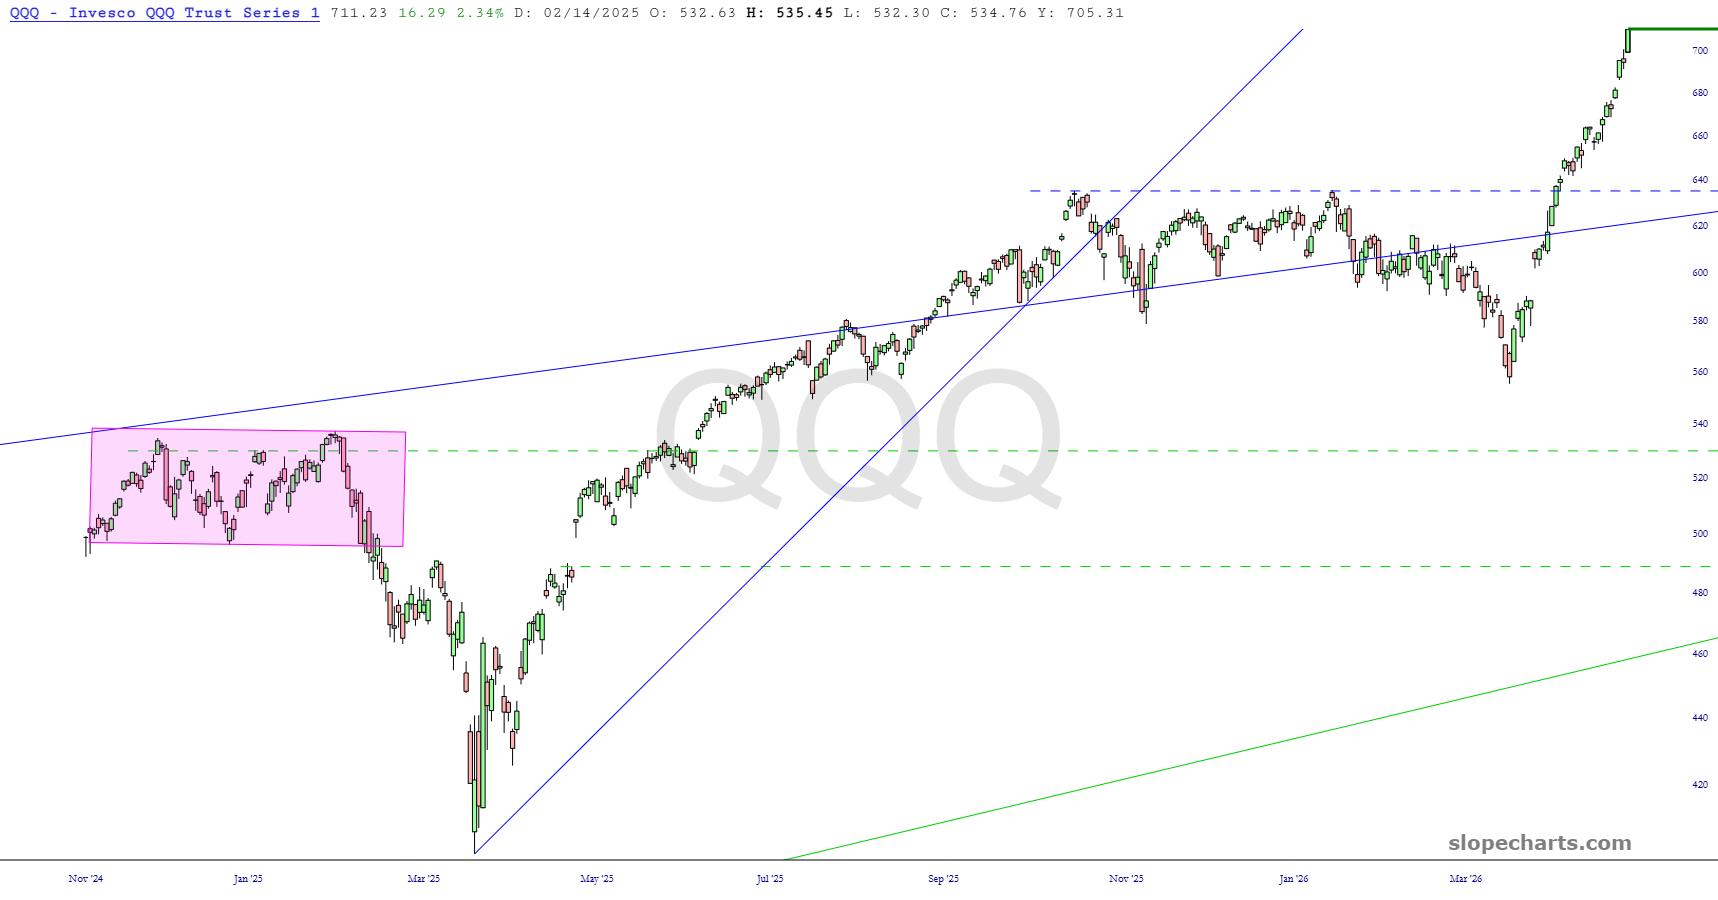
The tech stocks don’t even know the word “resistance” anymore. Lifetime highs tend to beget more lifetime highs, and until the wild-eyed maniacs stop buying stuff at any price named, this thing is just going to keep lurching skyward.
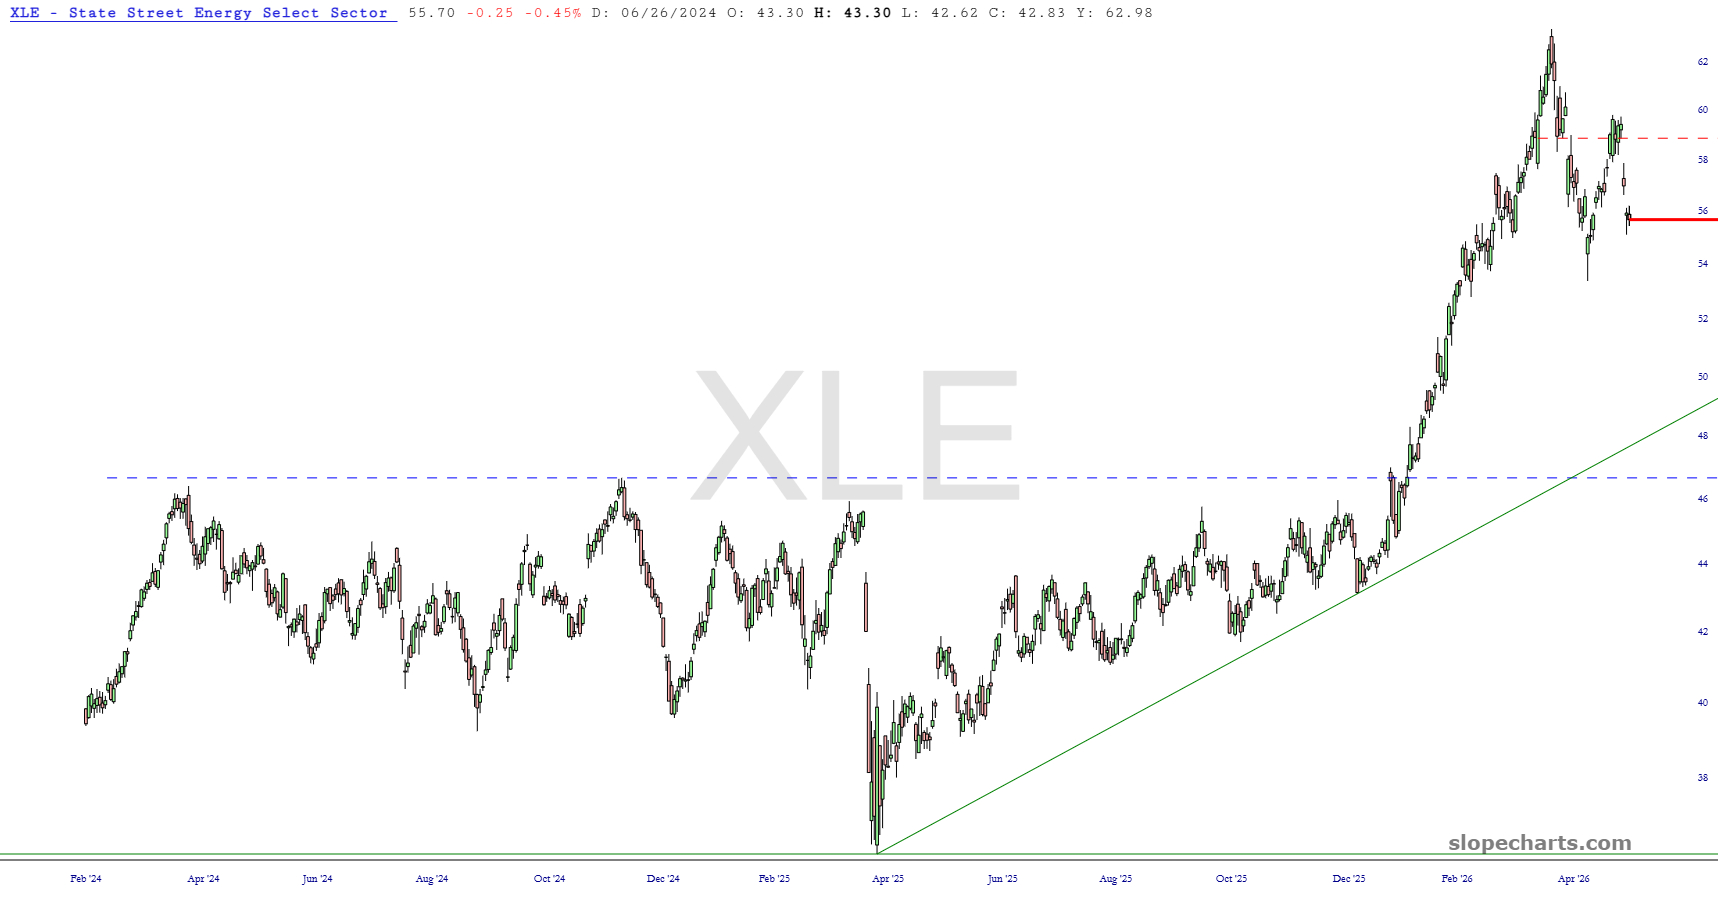
The evident end of the Iran “excursion” is causing energy stocks to be the only sector that’s actually selling off consistently these days.
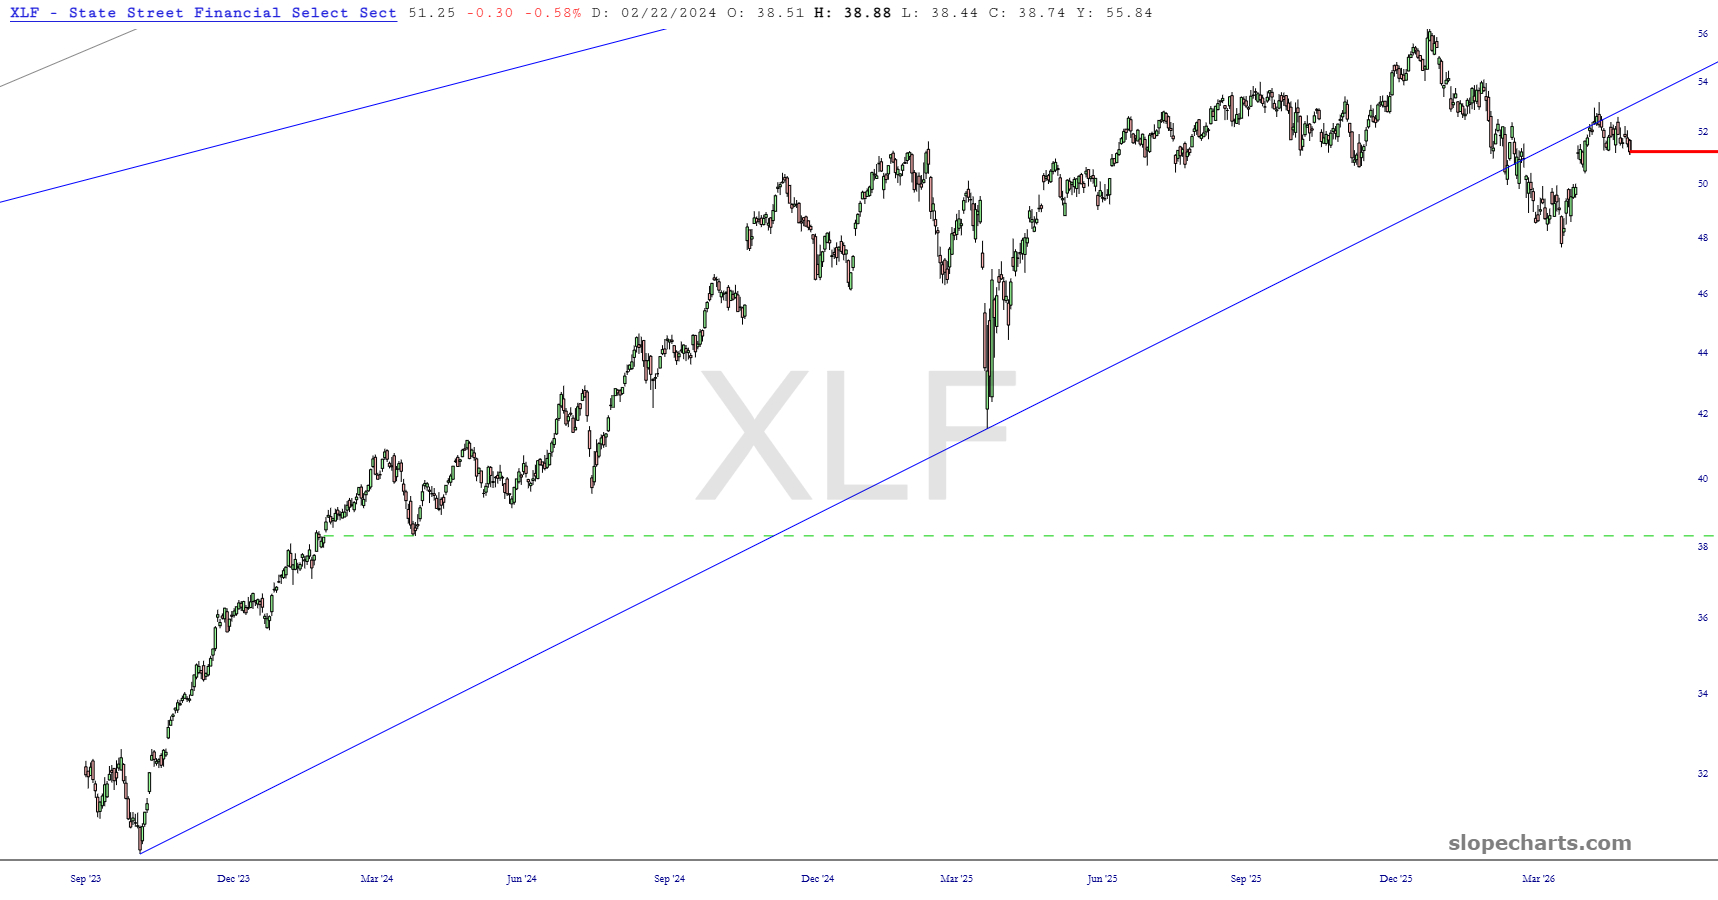
Financials are starting to break down beautifully, and this is one of the few ETF charts that has a very evident price failure.
Finally, lest is need repeating, tech stocks (this time by way of the lesser-known XLK as opposed to QQQ) are in absolutely la-la-land. In my forty years of charting stocks, I have honestly never seen anything so bizarre.