
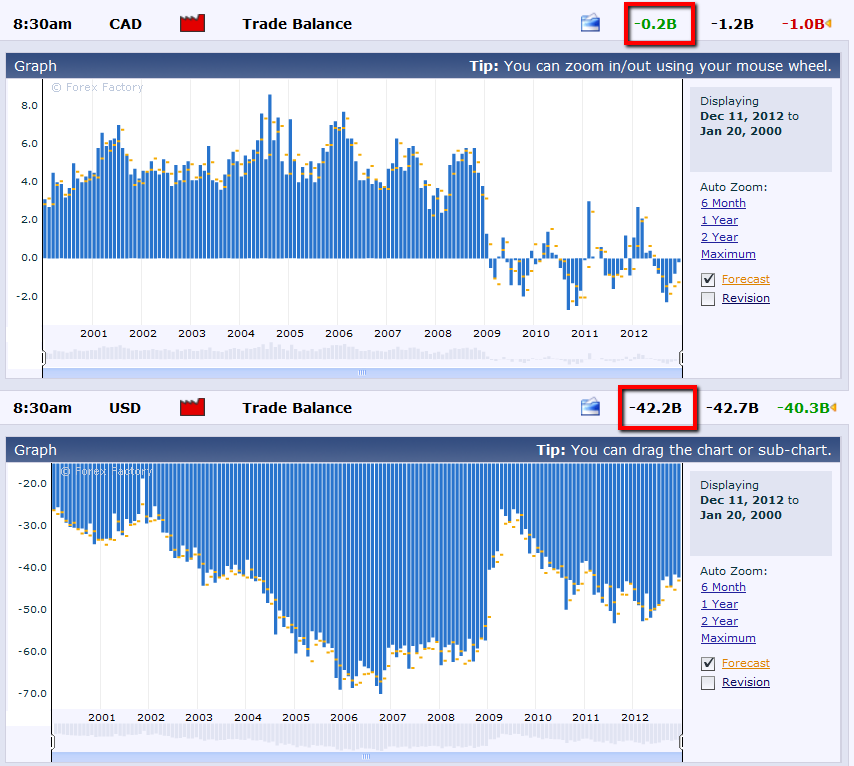
Data released today (Tuesday) shows that Canada's
Trade Balance deficit shrank, while it increased for the U.S.,
as shown on the graphs below.
U.S. index futures are
up in pre-market trading as I write this…we'll see whether they can hang onto
their overnight gains and whether this bullish sentiment can continue to produce
higher prices during market hours, in spite of this latest trade data, or
whether we see a reversal here. Markets have been shrugging off poor economic
data these past couple of months…how long can it continue? No doubt, they're
expecting a positive outcome of the FOMC meeting that begins today and wraps up
tomorrow. We may not see any reversal (if at all) until we know those
results…and, possibly, the results of the "Fiscal Cliff"
negotiations.
Meanwhile, the Weekly chart of the
USD/CAD forex pair shows that the U.S. $ has been
trading below parity (solid yellow line) since August of this year, and
failed to regain a foothold above in mid-November. It hasn't spent a lot of
time below parity during the past five years…time will tell whether this will
shift or not. At the moment, it's trading in deeply bearish territory in the
lower half of a triangle formation, below the 60% Fibonacci retracement
level, and below falling 20, 50, and 200 smas.

I've noticed that
price action on the USD/CAD over the past 5 years resembles that of the
VIX, as shown on the Weekly chart below. At
the moment, price is sitting on a downtrend line from the August 2011 highs. It
would appear that a the price level of 20.00 would need to be reclaimed and held
in order to confirm any reversal in both the USD/CAD and equities, in general. A
sudden, severe drop below this downtrend line may signal that equities have
climaxed and such a reversal is imminent.

