Slope of Hope Blog Posts

Slope initially began as a blog, so this is where most of the website’s content resides. Here we have tens of thousands of posts dating back over a decade. These are listed in reverse chronological order. Click on any category icon below to see posts tagged with that particular subject, or click on a word in the category cloud on the right side of the screen for more specific choices.

Bear Trap for Short-Sellers of FAANGs?

By -

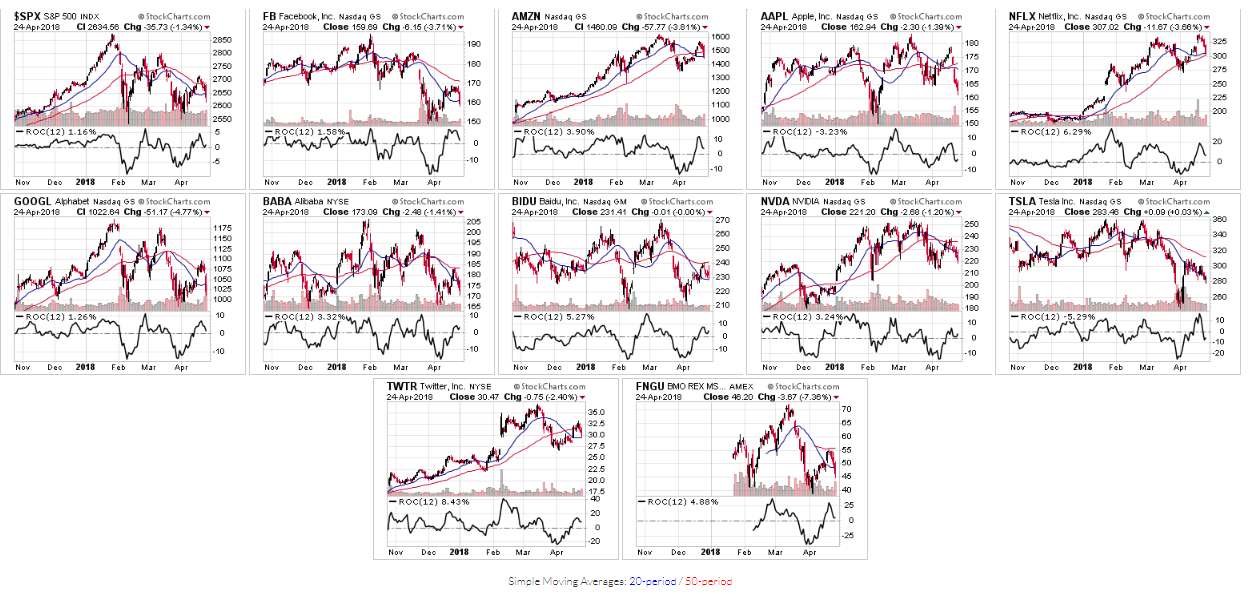
Was Tuesday’s downdraft just a shakeout of and a bear trap for short-sellers, or the beginning of further weakness in the FAANGs + 5 Tech stocks that make up FNGU?

Keep an eye on the ROC and the zero level on Chart #1 below. It’s shown with an input value of 12 days (its default setting).

So far, only AAPL and TSLA’s ROC has dropped below zero. If the others follow suit in the coming days, we may see a big selloff occur in Tech, overall.

(more…)

Is 90.00 a Floor for the US Dollar?

By -

The following monthly chart of the US Dollar (DX) contains three Andrew’s Pitchfork channels. The channel median apex for the two largest ones (pink and blue) sits at 90.00 and forms major channel support.

Price has been swirling around 90.00 since mid-January of this year. Recently, the DX has found support at the bottom of the smallest channel (green), which begins in March 2008. The momentum indicator has made a lower swing low, so it remains in downtrend on this timeframe and is still below the zero level, but has recently hooked upward.

(more…)

SPX Drops Below Major Support As 10-Yr Yields Tags 3%

By -

I last wrote about the S&P 500 Index on April 19 and also included a couple of updates later that day.

I mentioned that its latest rally that tagged 2700 was weak and that the intraday action that day was hinting that it could be a pivot point where we’d see price either spike back up to 2700 or plunge down to 2650, or lower.

As at 1:30 pm ET today (Tuesday) the SPX has plunged below 2650 as the 10-Yr Treasury Yields tagged 3%, as shown on the following daily chart. (more…)

Oil & Gold vs. Oil & Gold Volatility Indices

By -

Chart #1 is a monthly chart of WTIC Crude Oil (in the upper half) and the CL:OVX ratio (depicted in histogram format in the lower half).

As I’ve noted recently, the major price resistance and support levels are 80.00 and 60.00, respectively.

Corresponding to those are the major ratio resistance and support levels of 3.00 and 2.00, respectively. In this regard, it will be important for the ratio to remain above 2.00 and the ratio 5 MA to remain above the 8 MA to confirm an upward bias on Oil on this timeframe. (more…)