Slope of Hope Blog Posts

Slope initially began as a blog, so this is where most of the website’s content resides. Here we have tens of thousands of posts dating back over a decade. These are listed in reverse chronological order. Click on any category icon below to see posts tagged with that particular subject, or click on a word in the category cloud on the right side of the screen for more specific choices.

Gridlock in Washington and the Impact on Equity Markets

By -

Gridlock in Washington (with the utter failure to pass any kind of new healthcare reform) is the theme, so far, in 2017…with Republicans unable to agree to support their party’s latest bill, which is now completely dead, and Democrats simply obstructing everything in sight.

It looks like everyone is tired and unable to do what they were elected to do.

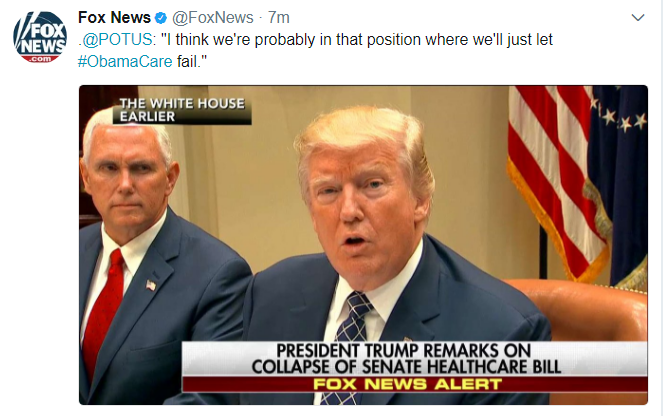
If everyone’s tired, how will this failure affect the progress of any other political items that President Trump has on his agenda?

(more…)

World Market “Buy” Signal Triggered

By -

A new “BUY” signal has just triggered on the World Market Index. I last wrote about this index on June 29th.

Price punched through 1900 (which will now need to hold as major support), the RSI has broken its latest downtrend and is back above 50, and there are new bullish crossovers on the MACD and PMO indicators, as shown on the following Daily chart.

(more…)

SPX: Q2 2017 Market Wrap-Up

By -

Each candle represents a period of one year on the following Yearly chart of the SPX.

So far, this year’s candle is a bit less than half of 2016’s trading range and the Momentum indicator is almost as high as it was in 2014 (this year’s trading range is about 60% as high as 2014’s).

What this tells me is that, on an annual basis, 2017 is fairly strong at this point and could perform well in the latter half of the year.

(more…)

Volatility Heats Up…Summer Selloff Ahead?

By -

The following three ratio charts compare the strength of the NDXRUT, and SPX with their respective Volatility Index.

The following NDX:VXN ratio chart shows that NDX is sitting in a precarious spot at a rising trendline, but well below what is now major resistance. All 3 technical indicators are still in “SELL” mode, as rising volatility outstrips price performance.

(more…)