The following Year-to-date percentage gained/lost graph of the Major Indices shows that the Small Cap Index (Russell 2000) has dropped by 5.22% since January 1st of this year…a significant variance from the others.
Slope initially began as a blog, so this is where most of the website’s content resides. Here we have tens of thousands of posts dating back over a decade. These are listed in reverse chronological order. Click on any category icon below to see posts tagged with that particular subject, or click on a word in the category cloud on the right side of the screen for more specific choices.
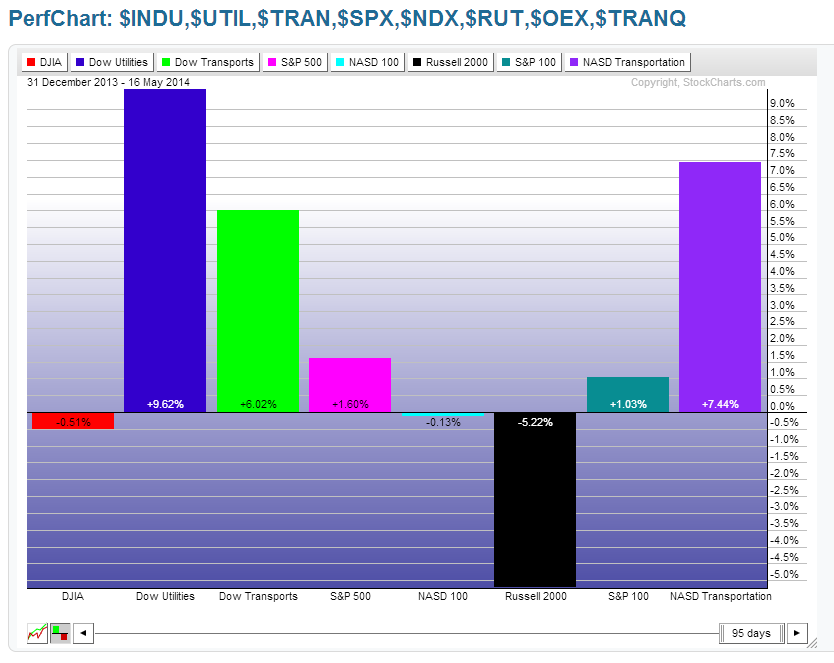
The following Year-to-date percentage gained/lost graph of the Major Indices shows that the Small Cap Index (Russell 2000) has dropped by 5.22% since January 1st of this year…a significant variance from the others.
Recent weakness in the European Financials ETF (EUFN) was punctuated by today’s (Thursday’s) gap down and close below the 50 day MA, as shown on the following 1-year Daily chart.
All 3 technical indicators have also dropped below their respective mid-point…signalling potential further weakness ahead. Major support sits around 23.50 to 24.50. Failure (drop and hold) below 23.50 could spark a major sell-off in European stocks…one to watch in the weeks ahead…particularly as the next ECB meeting approaches on June 5th. (more…)
The following 11 1-Year Daily charts show the 9 Major Sectors, plus Housing and Biotech.
You can see that Technology (XLK), Industrials (XLI), Materials (XLB), Energy (XLE), and Consumer Staples (XLP) have been the strongest performers, of late. The laggards have been Housing (XHB) and Biotech (IBB) (more…)
The following 3-year Daily Ratio chart of the Russian Index vs. the German Index shows a very recent bounce in favour of Russia, following a 3 year relative decline in Russia’s strength in the markets. All three technical indicators have now been pulled into positive territory (above their mid-points), and price has bounced above the declining 50 day moving average. Major resistance sits around the declining 200 day moving average.
I’d watch to see if these levels are held in the days/weeks ahead as a possible gauge of any easing of tensions between these two countries and softening of sanctions against Russia over the Ukraine situation…resulting in a strengthening of the Russian markets. Otherwise, a drop and hold below the March lows could spell bigger political unrest and trouble ahead. (more…)
The following 3-year Daily ratio charts compare the price action, strength/weakness, and current price level of the SPX with a number of major world indices, commodities, and 30-year bonds.
You can see, at a glance, that the SPX has been weaker than most of the other major world indices, of late (other than China, Japan, and, to some extent, Australia), and price sits at or near to major support. On the other hand, the SPX has been stronger recently than the NDX and the RUT, as well as Gold, Silver, Copper and Oil. The SPX vs the World Index is slightly weaker, and price sits at major support. The SPX has been stronger than 30-year bonds, but is sitting in between major support and resistance in a neutral zone. (more…)
