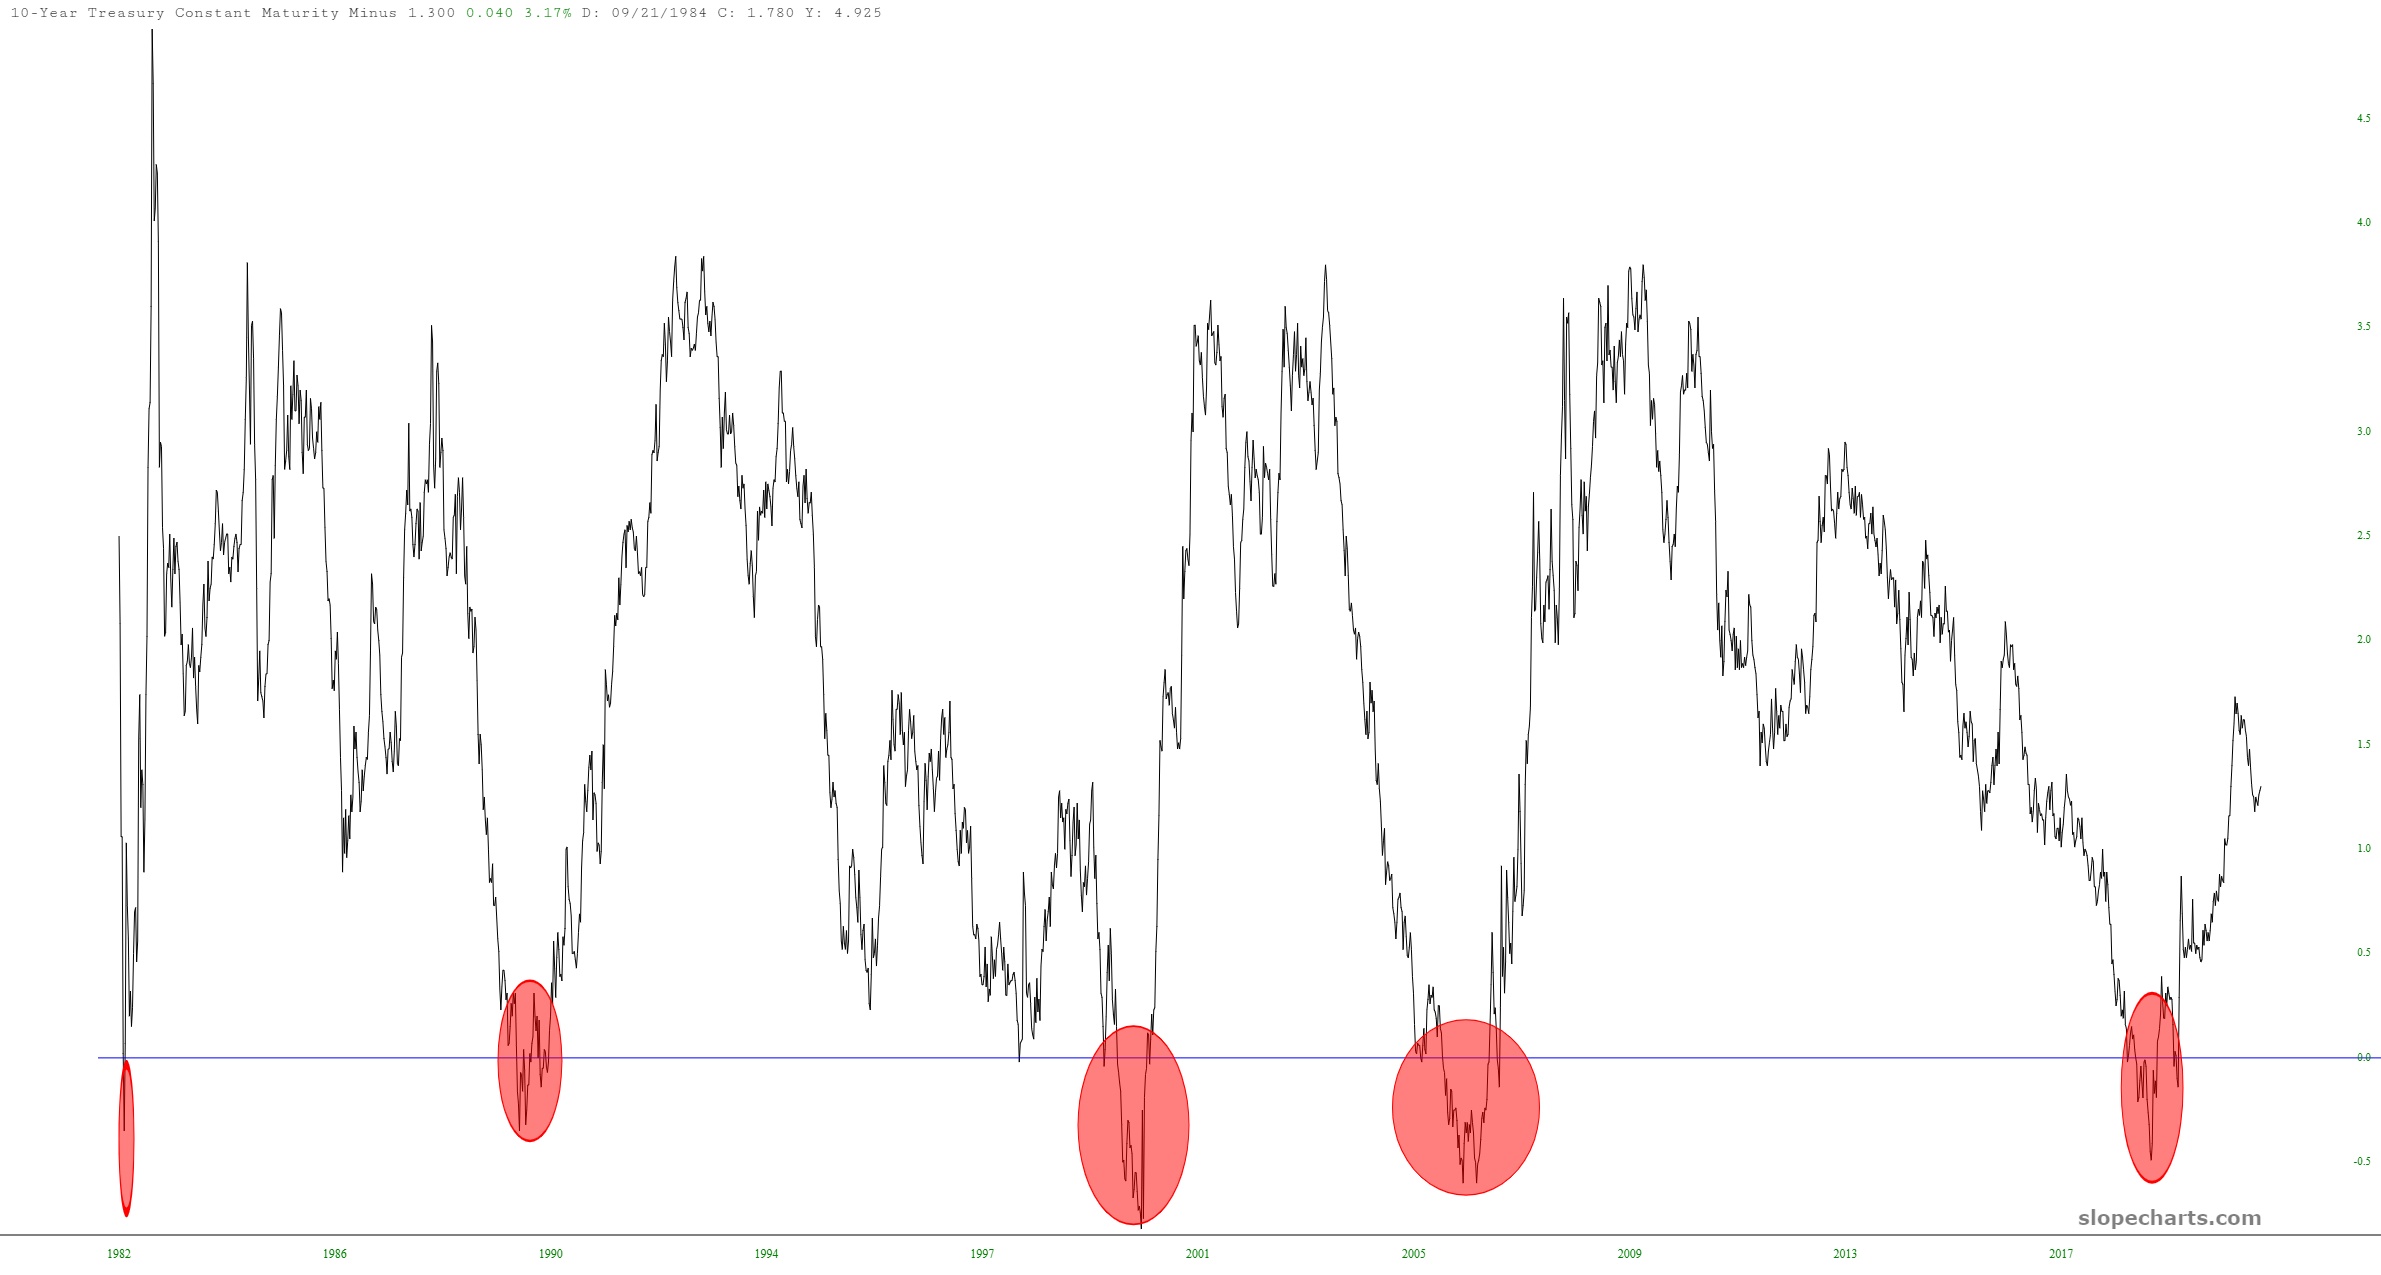
Here is a chart we haven’t looked at in a very long time. The symbol is FR:T10Y3M in SlopeCharts, and it shows the 10 year rate minus the 3 month rate, which has been a flawless predictor of recessions. We watched it as we approached the “trigger line”, although little did we know precisely what would be to blame for the ensuing recession that did, in fact, take place.