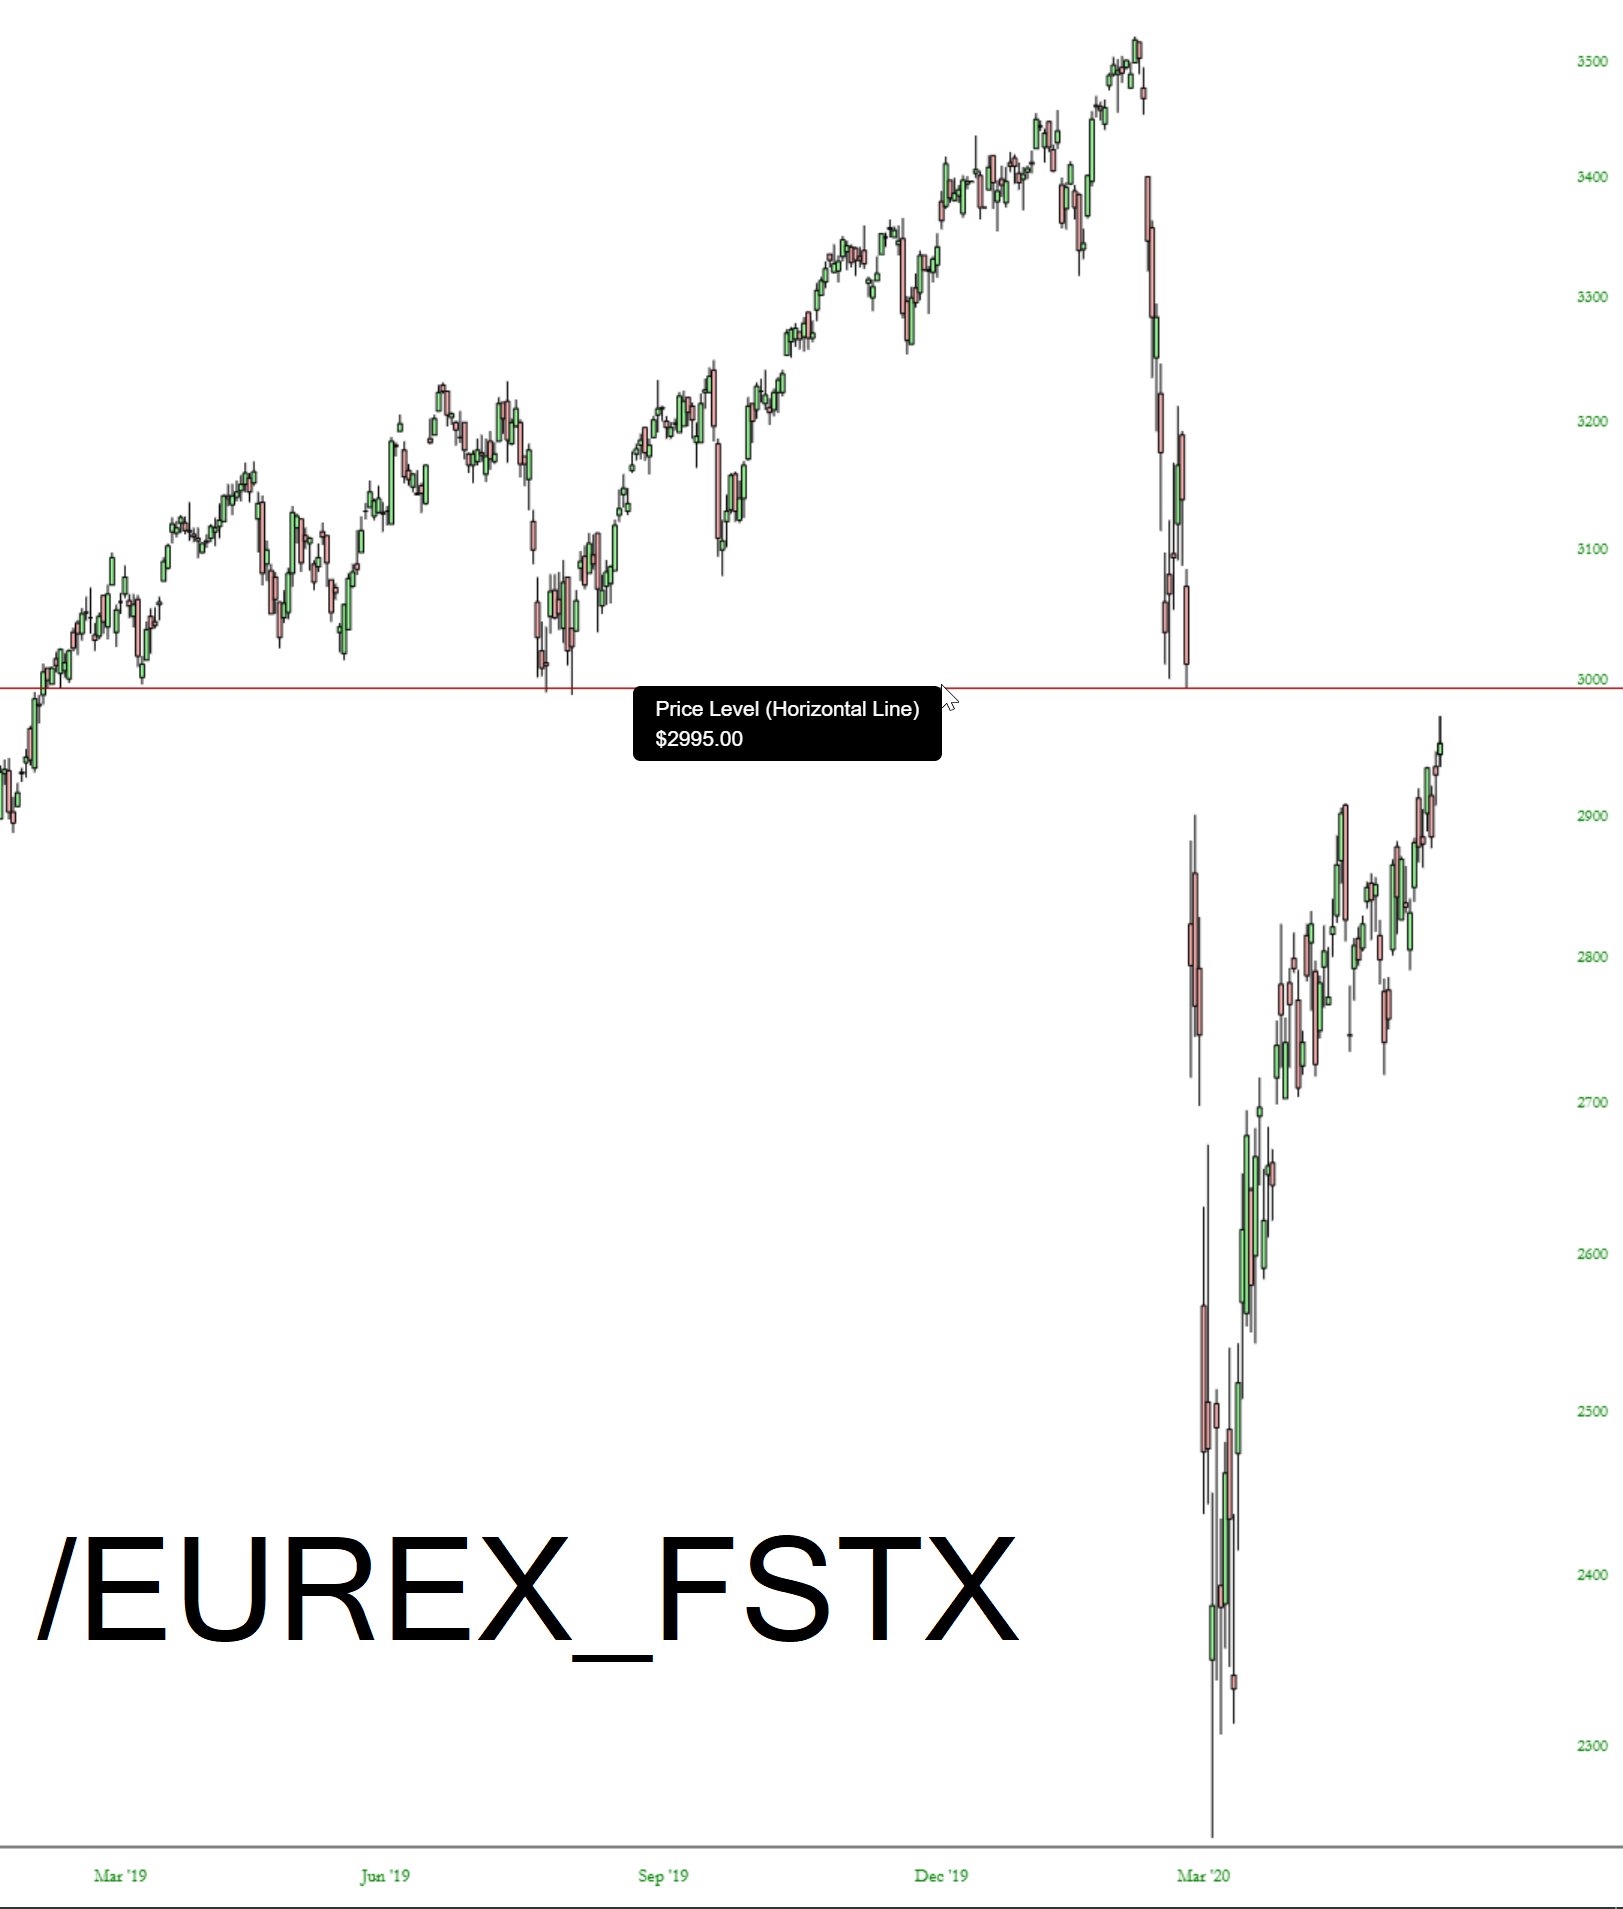
I don’t think many folks here trade futures, but SlopeCharts has a rich collection of futures charts, and I thought a few were worth sharing with you. First up is the FTSE 100 chart. Take note of that monstrous gap which is just about closed.
Slope initially began as a blog, so this is where most of the website’s content resides. Here we have tens of thousands of posts dating back over a decade. These are listed in reverse chronological order. Click on any category icon below to see posts tagged with that particular subject, or click on a word in the category cloud on the right side of the screen for more specific choices.
I don’t think many folks here trade futures, but SlopeCharts has a rich collection of futures charts, and I thought a few were worth sharing with you. First up is the FTSE 100 chart. Take note of that monstrous gap which is just about closed.
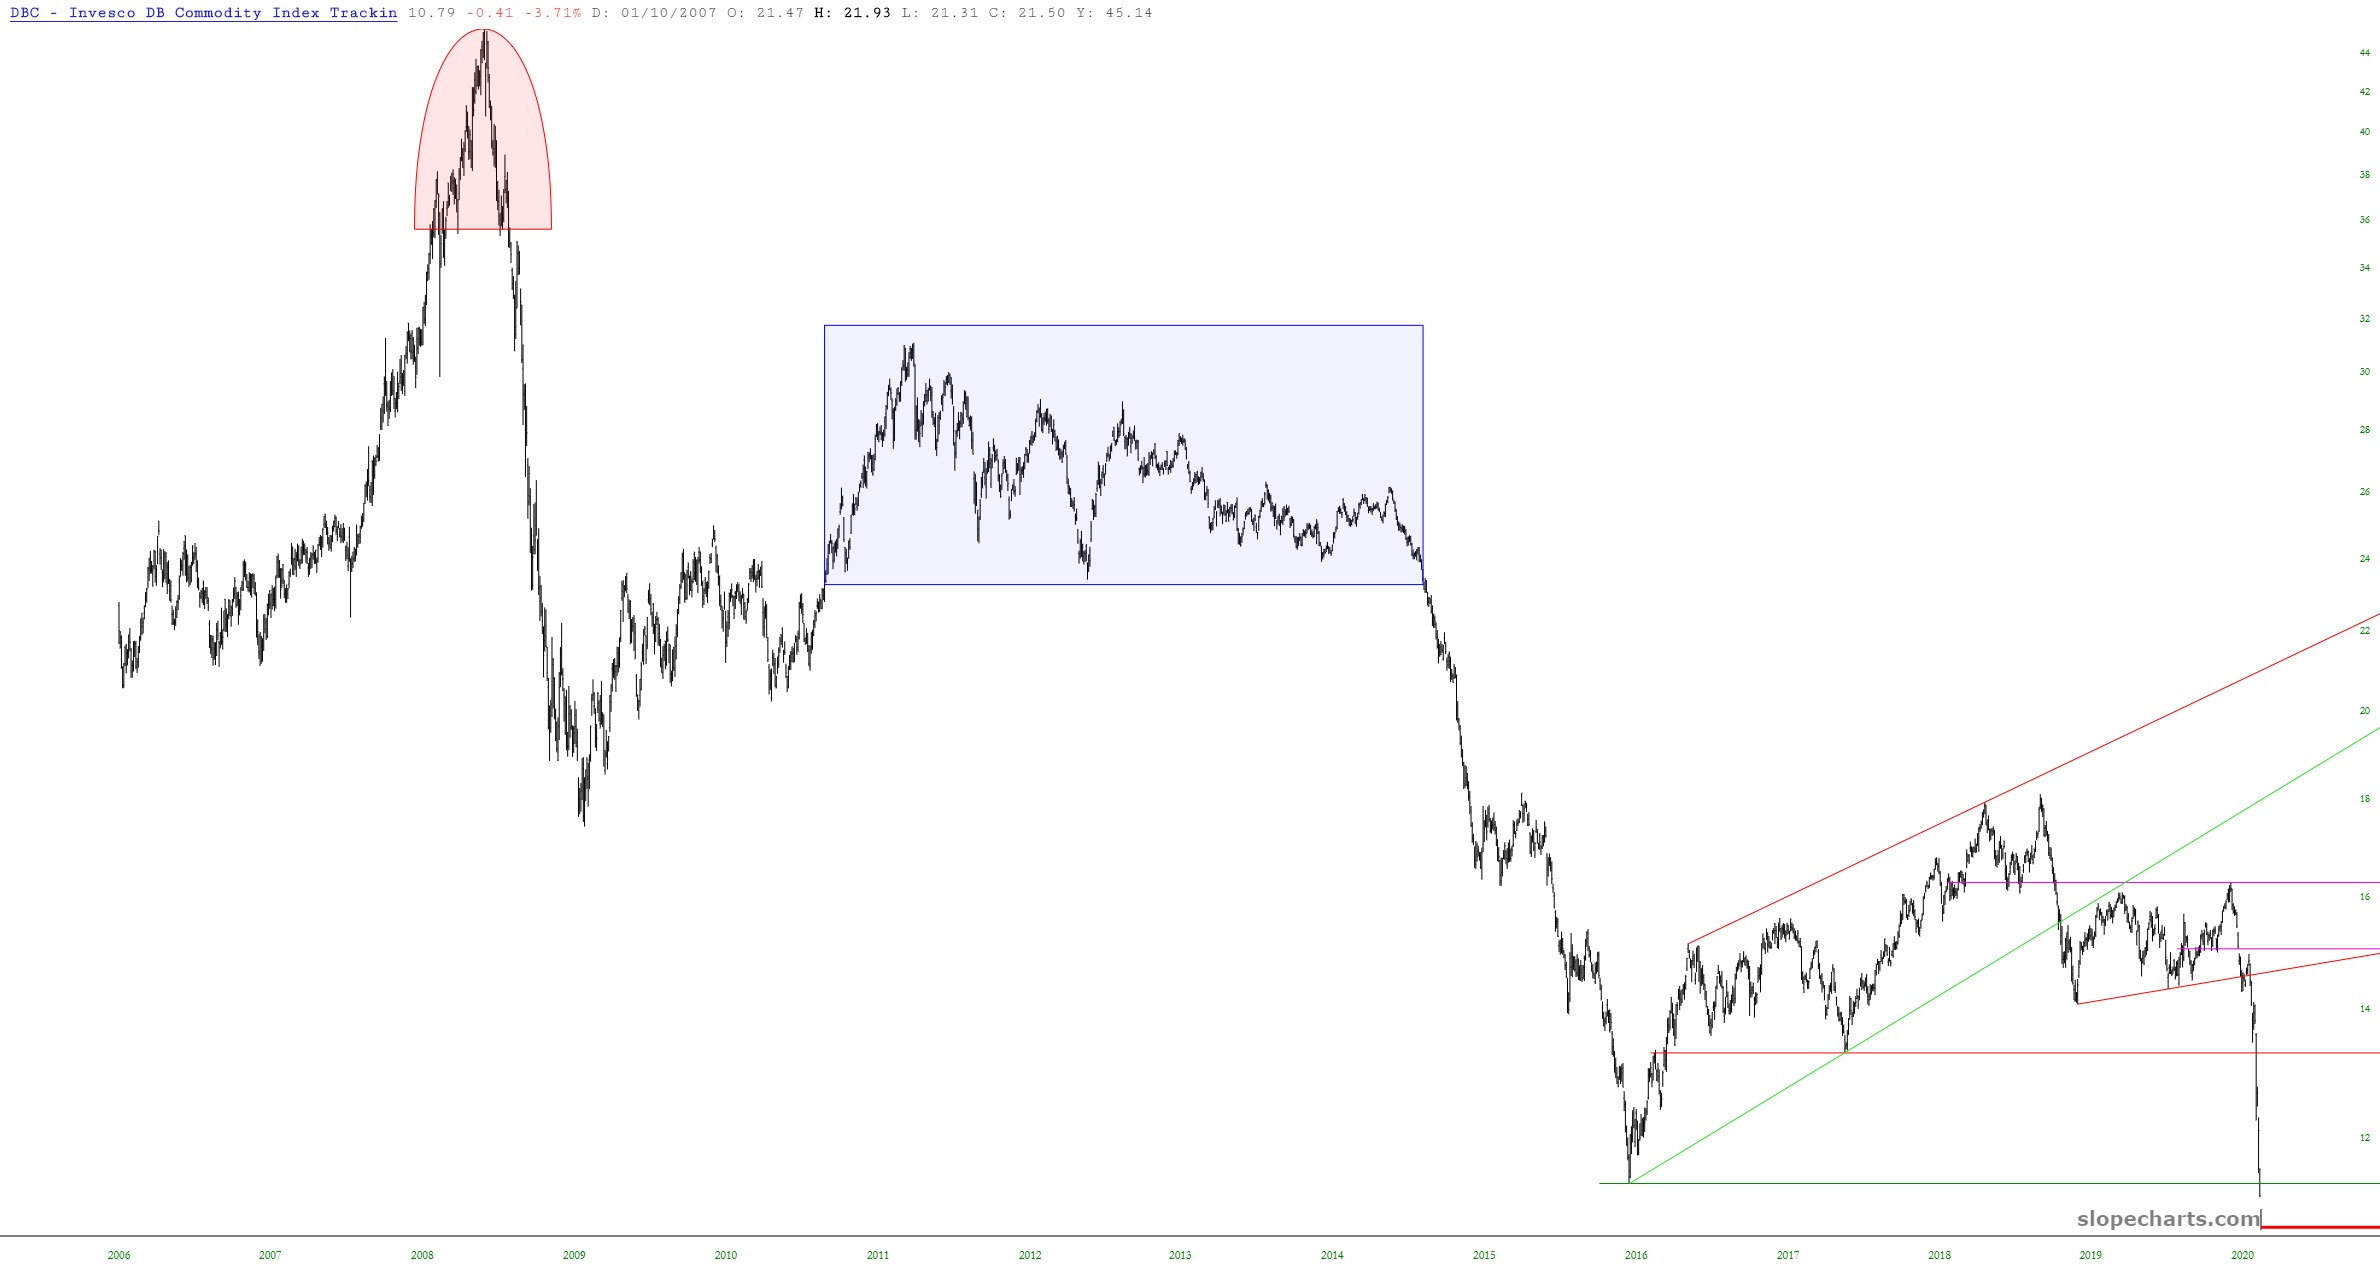
The drop in crude oil the past couple of months has been absolutely unprecedented and is already in the process of reshaping the financial landscape for years to come.

Never-before-seen lows in DBC:
The following weekly chart of COPPER shows that its price has fluctuated wildly around the 2.47 level in an increasingly narrowing triangle formation since the end of the 2008 global financial crisis. At the moment it’s acting as major support and happens to coincide with the triangle apex. A drop and hold below this level could see a sharp downdraft in this commodity to around 2.20 (price support combined with the bottom of the triangle and a secondary volume bump), or lower.
Major overhead resistance sits at the confluence of the 50 & 200-month moving averages with the Volume Profile POC around 2.70. A spike and hold above this level could see price rise to around 2.99 (price resistance combined with the top of the triangle and a secondary volume bump), or higher.
(more…)