Do us both a quick favor and pull up my Boiling It Down post from just days ago. Got it? OK, good. Now please look at this chart:
Slope initially began as a blog, so this is where most of the website’s content resides. Here we have tens of thousands of posts dating back over a decade. These are listed in reverse chronological order. Click on any category icon below to see posts tagged with that particular subject, or click on a word in the category cloud on the right side of the screen for more specific choices.
Do us both a quick favor and pull up my Boiling It Down post from just days ago. Got it? OK, good. Now please look at this chart:
I had actually forgotten we even HAD the volume profile study. I gave my all-important XLU a look, and this is encouraging, since there’s a thick wall holding off price ascent.

Looks like Powell won. No matter how high interest rates get cranked, and no matter how much debt the nation issues, assets just keep going higher. They’ve been doing it practically nonstop for nine months now, and even after yesterday’s latest ramp bump, and warning there may be more to come, the screen is fully green.
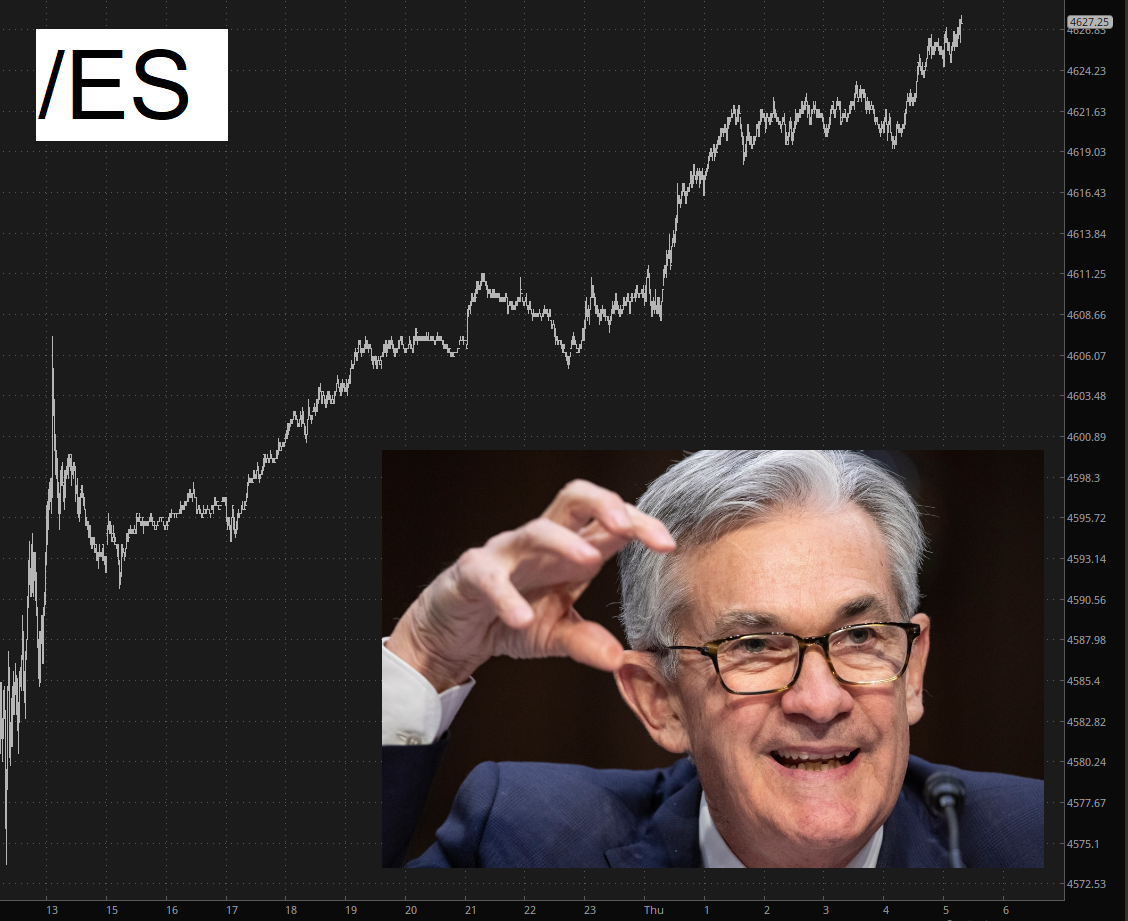
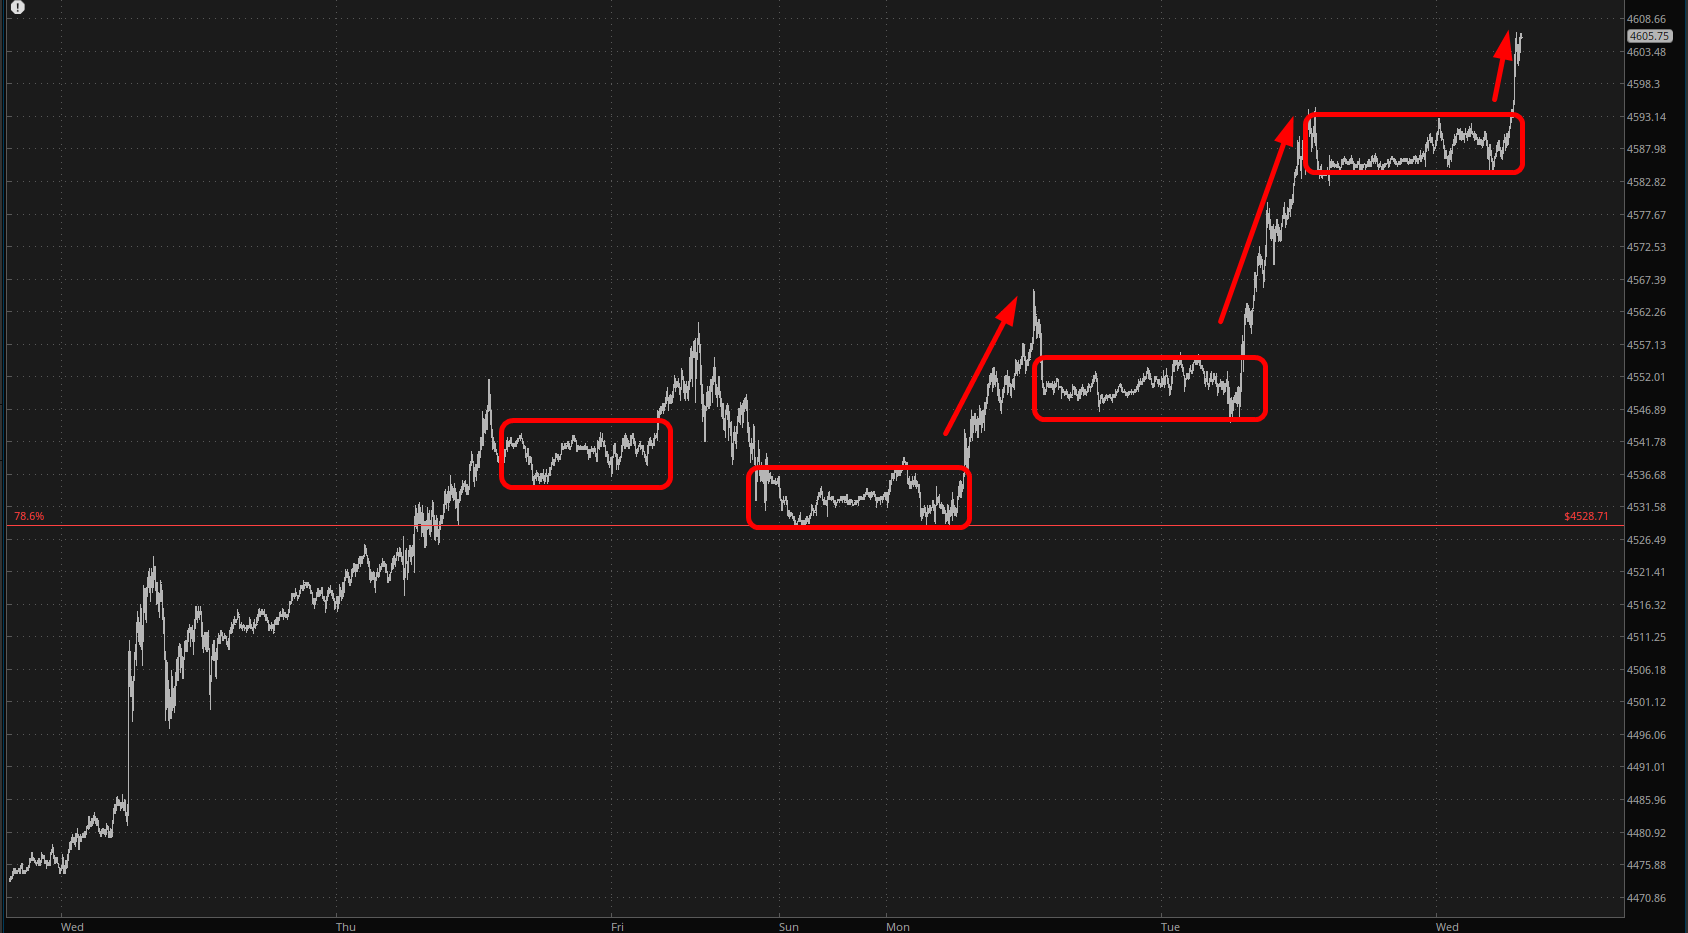
2023 remains the walled garden of equity bulls. The /ES futures basically park themselves for a few hours, barely moving at all, and then once the regular cash market opens, it’s off to the races.
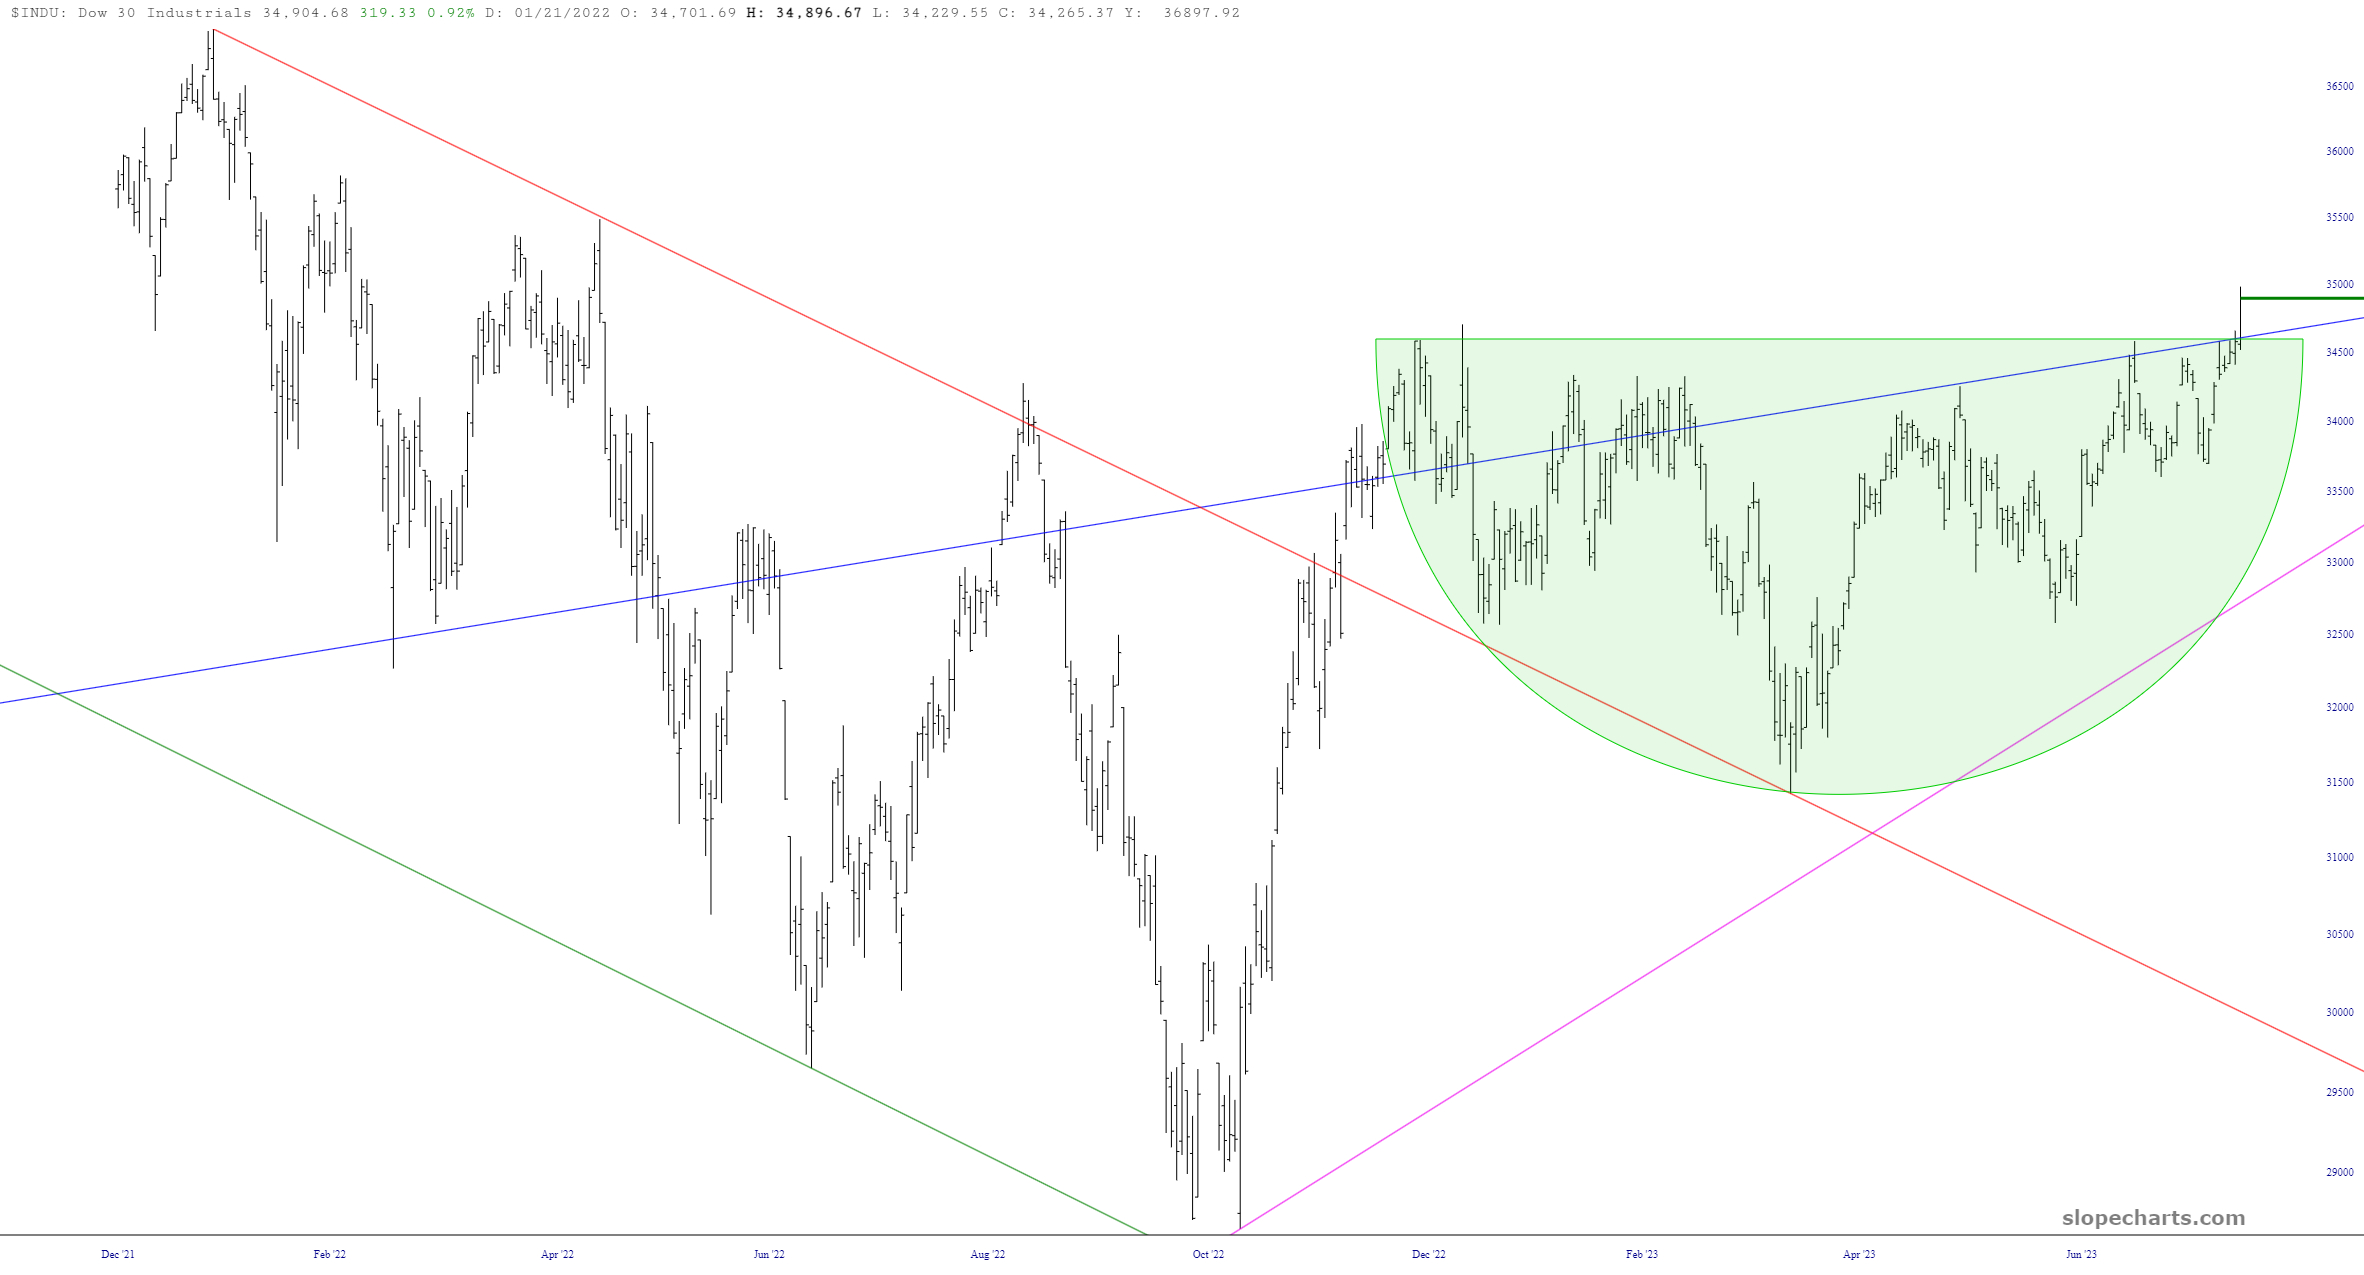
Yet another nail in the bearish coffin: The Dow 30 Industrials have completed an inverted H&S Pattern.