Slope of Hope Blog Posts
Slope initially began as a blog, so this is where most of the website’s content resides. Here we have tens of thousands of posts dating back over a decade. These are listed in reverse chronological order. Click on any category icon below to see posts tagged with that particular subject, or click on a word in the category cloud on the right side of the screen for more specific choices.
Wave Down into 11,600 for FXCM US Dollar Index?
$USDOLLAR From an Elliott Wave perspective the consolidation pattern in the FXCM US Dollar Index that we have seen since the May 13th low could be viewed in one of two ways. The first of which is that the May 13th low was the wave a of (iv) and this consolidation pattern was a b wave triangle after which we expect a c wave down to complete wave (iv) into the 11,600 area before continuing back higher in our larger degree bullish pattern. This is my preferred count at this time and is shown in white on the charts:
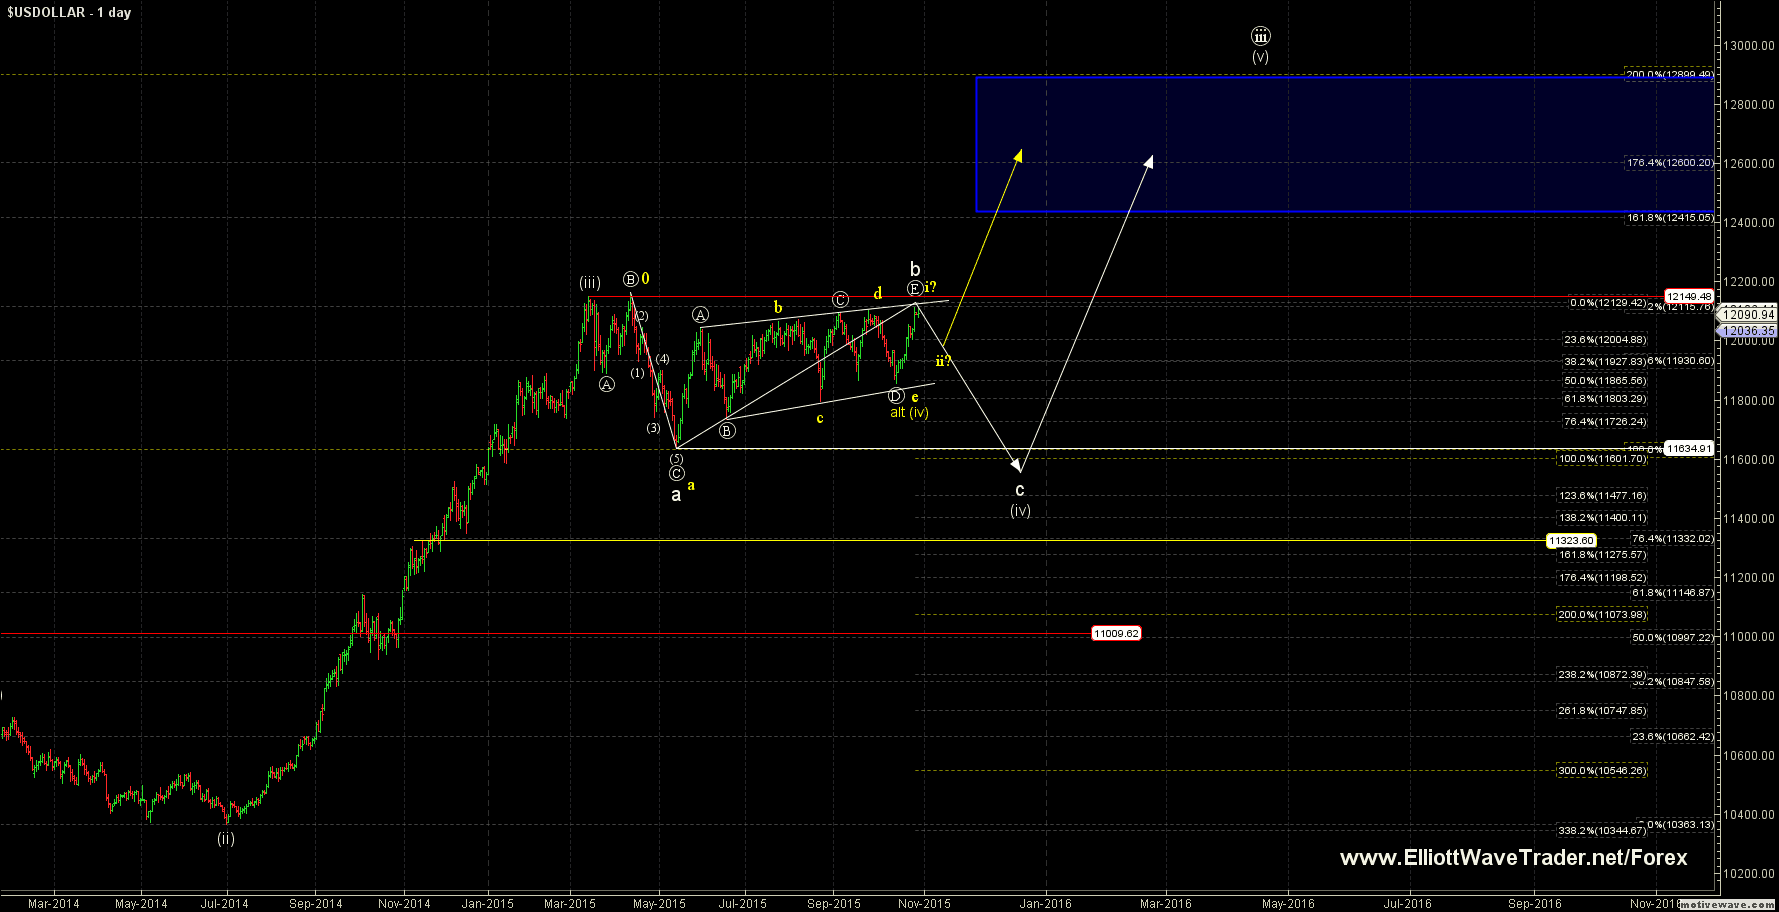
Originally published on ElliottWaveTrader.net, by Mike Golembesky.
Targets on EURUSD
EURUSD: 1.09678 — ideal Fib support and possible target for the wave (i) down — was not hit yet. But relatively small bounce provided us with moderate overbought indication — and I still can expect at least 1.09678 target to be reached before the larger corrective bounce will occur.

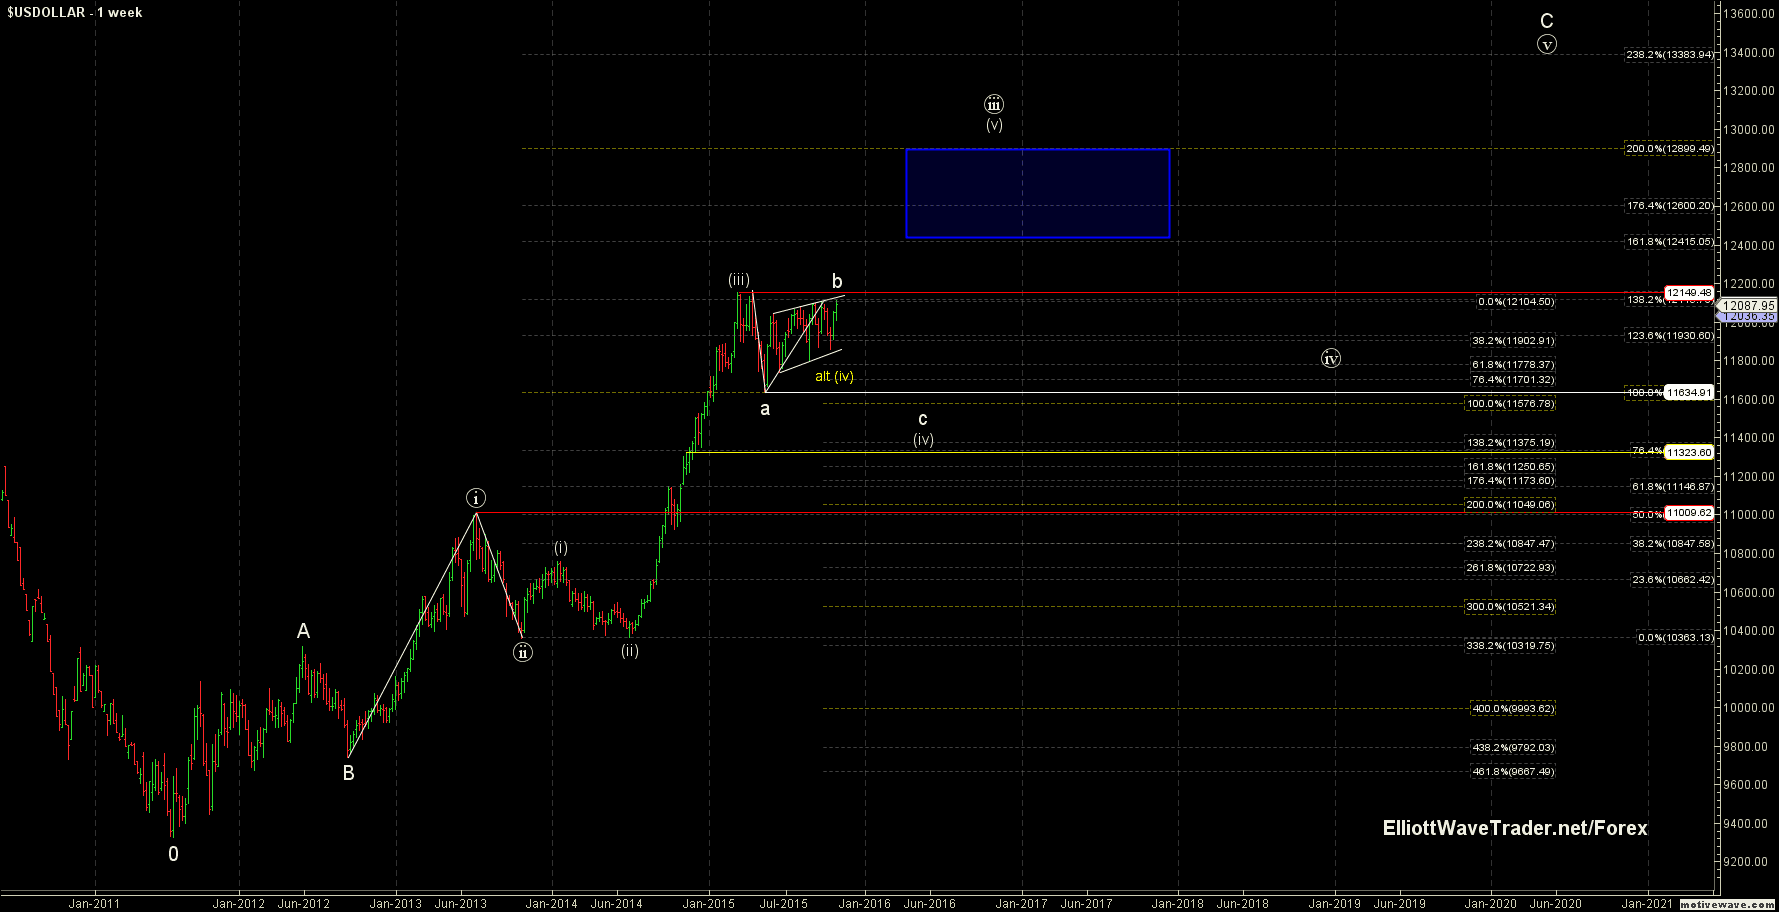
DXY Should Finally Be In Wave iii
We are still hearing an abundance of calls for the death to the US Dollar, which have amazingly continued during this entire rally from 2011 – which we called for back then. But, the dollar has given no indications that it has even been afflicted with an ailment, so the dire prognosis is quite surprising to me.
Rather, we have been in a long 4th wave consolidation, and set up to head higher quite imminently, as we have been suggesting for the last few weeks. Anyone following fundamentals or who has bought into the perceived power of the Fed over the dollar has completely missed this rally since 2011, but Elliott Wave analysis has provided the true clues to this market.
Next Wave Down in USDJPY
$USDJPY hit upper level of resistance on this pair for the potential top of wave ((ii)) at the 119.96 level. Ideally this level should hold if we are going to see an immediate drop for wave ((iii)) of C of (B) down. Initial targets for wave ((iii)) come in in the 115.97 – 114.94 level with ultimate targets for wave ((v)) of C much lower. Again invalidation of this setup occurs with a break over the 120.57 level.
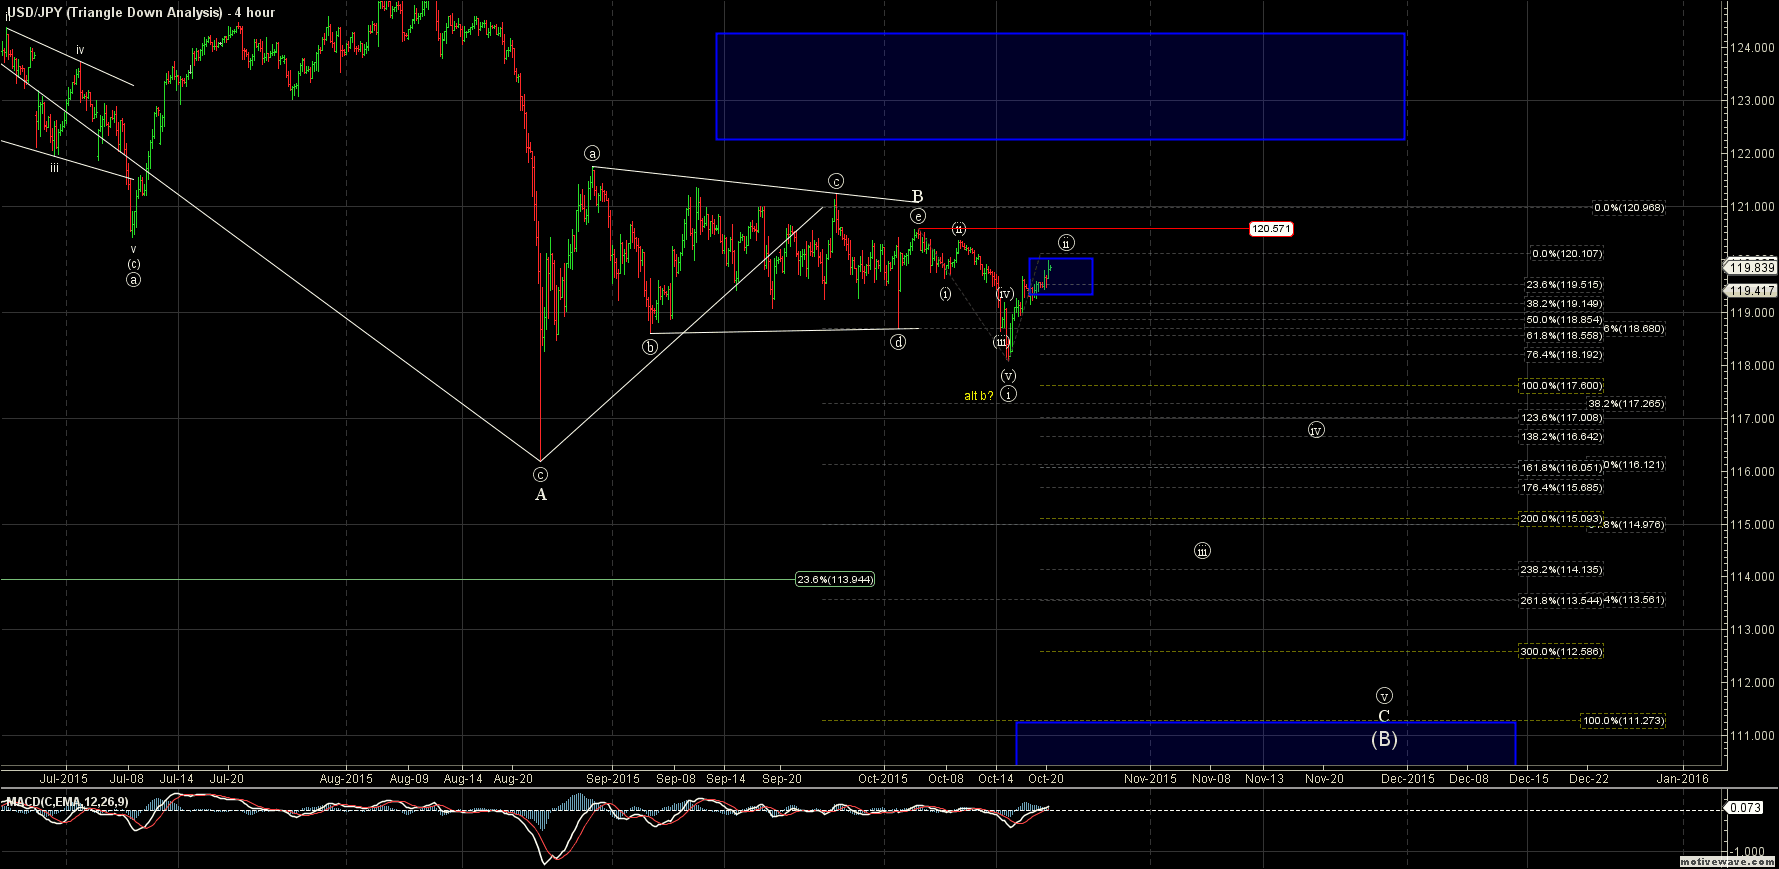
Originally published on ElliottWaveTrader.net, by Mike Golembesky.
