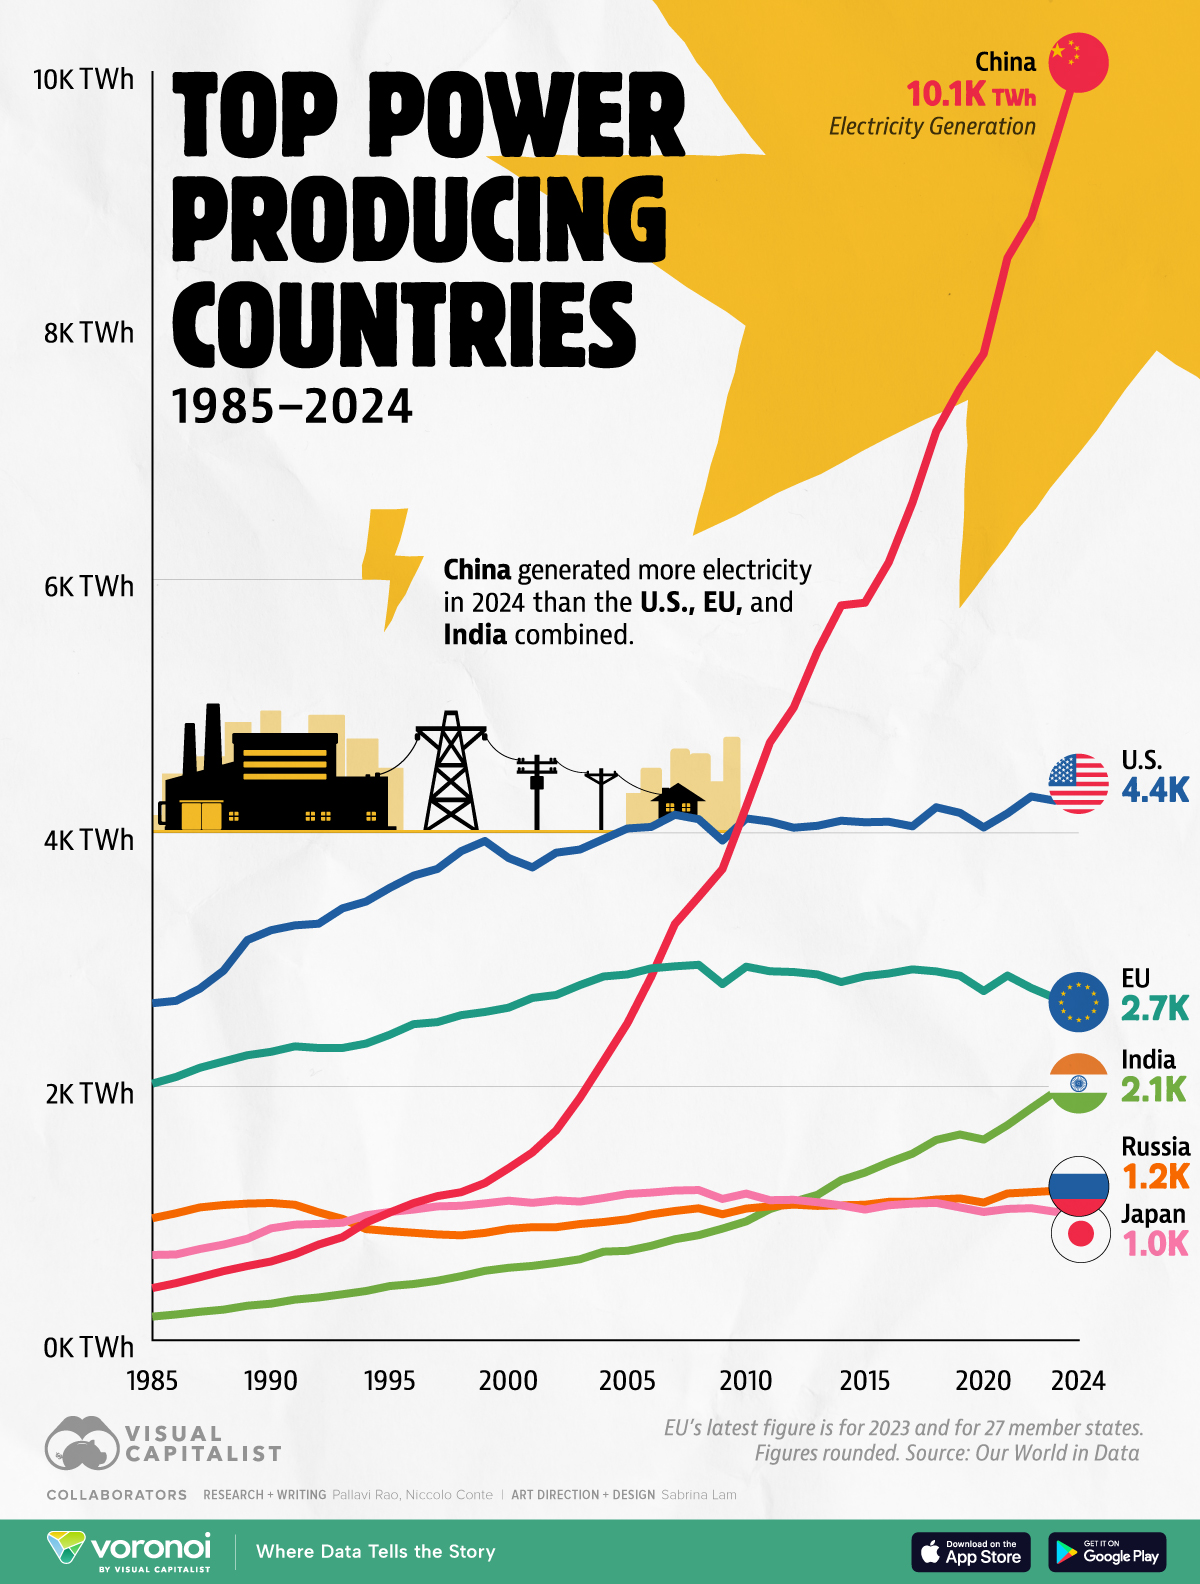
International Power
Slope initially began as a blog, so this is where most of the website’s content resides. Here we have tens of thousands of posts dating back over a decade. These are listed in reverse chronological order. Click on any category icon below to see posts tagged with that particular subject, or click on a word in the category cloud on the right side of the screen for more specific choices.
Eight days from now, on June 12th, Tesla is scheduled to launch their long-awaited (and I’m talking years) Robotaxi service. The eventually success or failure of this concept could be one of the most important events in the corporation’s history, since Mr. Musk has devoted so much of the company’s and resources toward the success of self-driving electric taxis.

Greeting from our nation’s capital. Yes, Bear Force One and Air Force One are parked side-by-side, as I engage in a final whirlwind trip, this one measuring only thirty hours. All will be back to normal Tuesday morning, and Duke and I look forward to that.
Over the course of the evening, equities have softened, although by a very disappointing amount considering all the renewed Let’s Get China saber-rattling. (I would also note I am composing this little piece three hours before the opening bell, so don’t throw your wireless mouse at me if your chart looks different).