Slope initially began as a blog, so this is where most of the website’s content resides. Here we have tens of thousands of posts dating back over a decade. These are listed in reverse chronological order. Click on any category icon below to see posts tagged with that particular subject, or click on a word in the category cloud on the right side of the screen for more specific choices.
With the /ES at the highest point in human history at this very moment, it may seem odd to dare point out any sector that is potentially bearish, but – – – that’s what I’m here for. May I direct your attention to the oil and gas sector, by way of the $XOI index.
XLE has zigged while CL zagged. I see a gap: crude already trading at a level that could justify XLE down in the $85 area, and crude looks like it’ll drop to $62 per barrel if it makes a new low.
Risks for crude prices: deregulation under Trump, peace with Russia ending sanctions (my guess is oil and gas sales would be resumed first), and the ongoing slowdown in major economies from Asia to Europe.
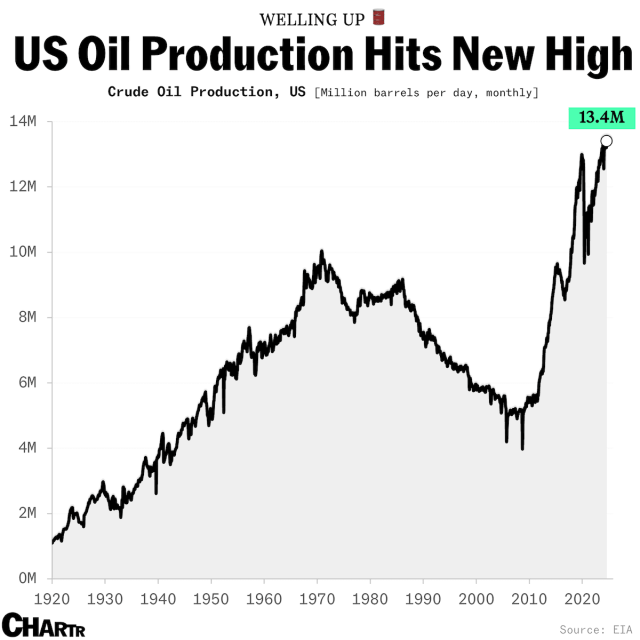
Although I have been painfully aware for my entire life how stupid most people are, and how gullible, feckless, and lacking any sense of history the body politic tends to be, I still find the oft-repeated phrase “Drill, Baby, Drill” to be particularly vexing.
First, these dimwits don’t recognize that it is a direct descendent of “Burn, Baby, Burn,” a celebration of lighting U.S. flags on fire during the Vietnam War era, and second, because the notion is predicated on the lie that the U.S. is somehow stymied in its production of crude oil and is at the mercy of the A-rabs. Umm, yeah, doofuses, the facts disagree: