Slope of Hope Blog Posts
Slope initially began as a blog, so this is where most of the website’s content resides. Here we have tens of thousands of posts dating back over a decade. These are listed in reverse chronological order. Click on any category icon below to see posts tagged with that particular subject, or click on a word in the category cloud on the right side of the screen for more specific choices.
ETF Review 1 of 3
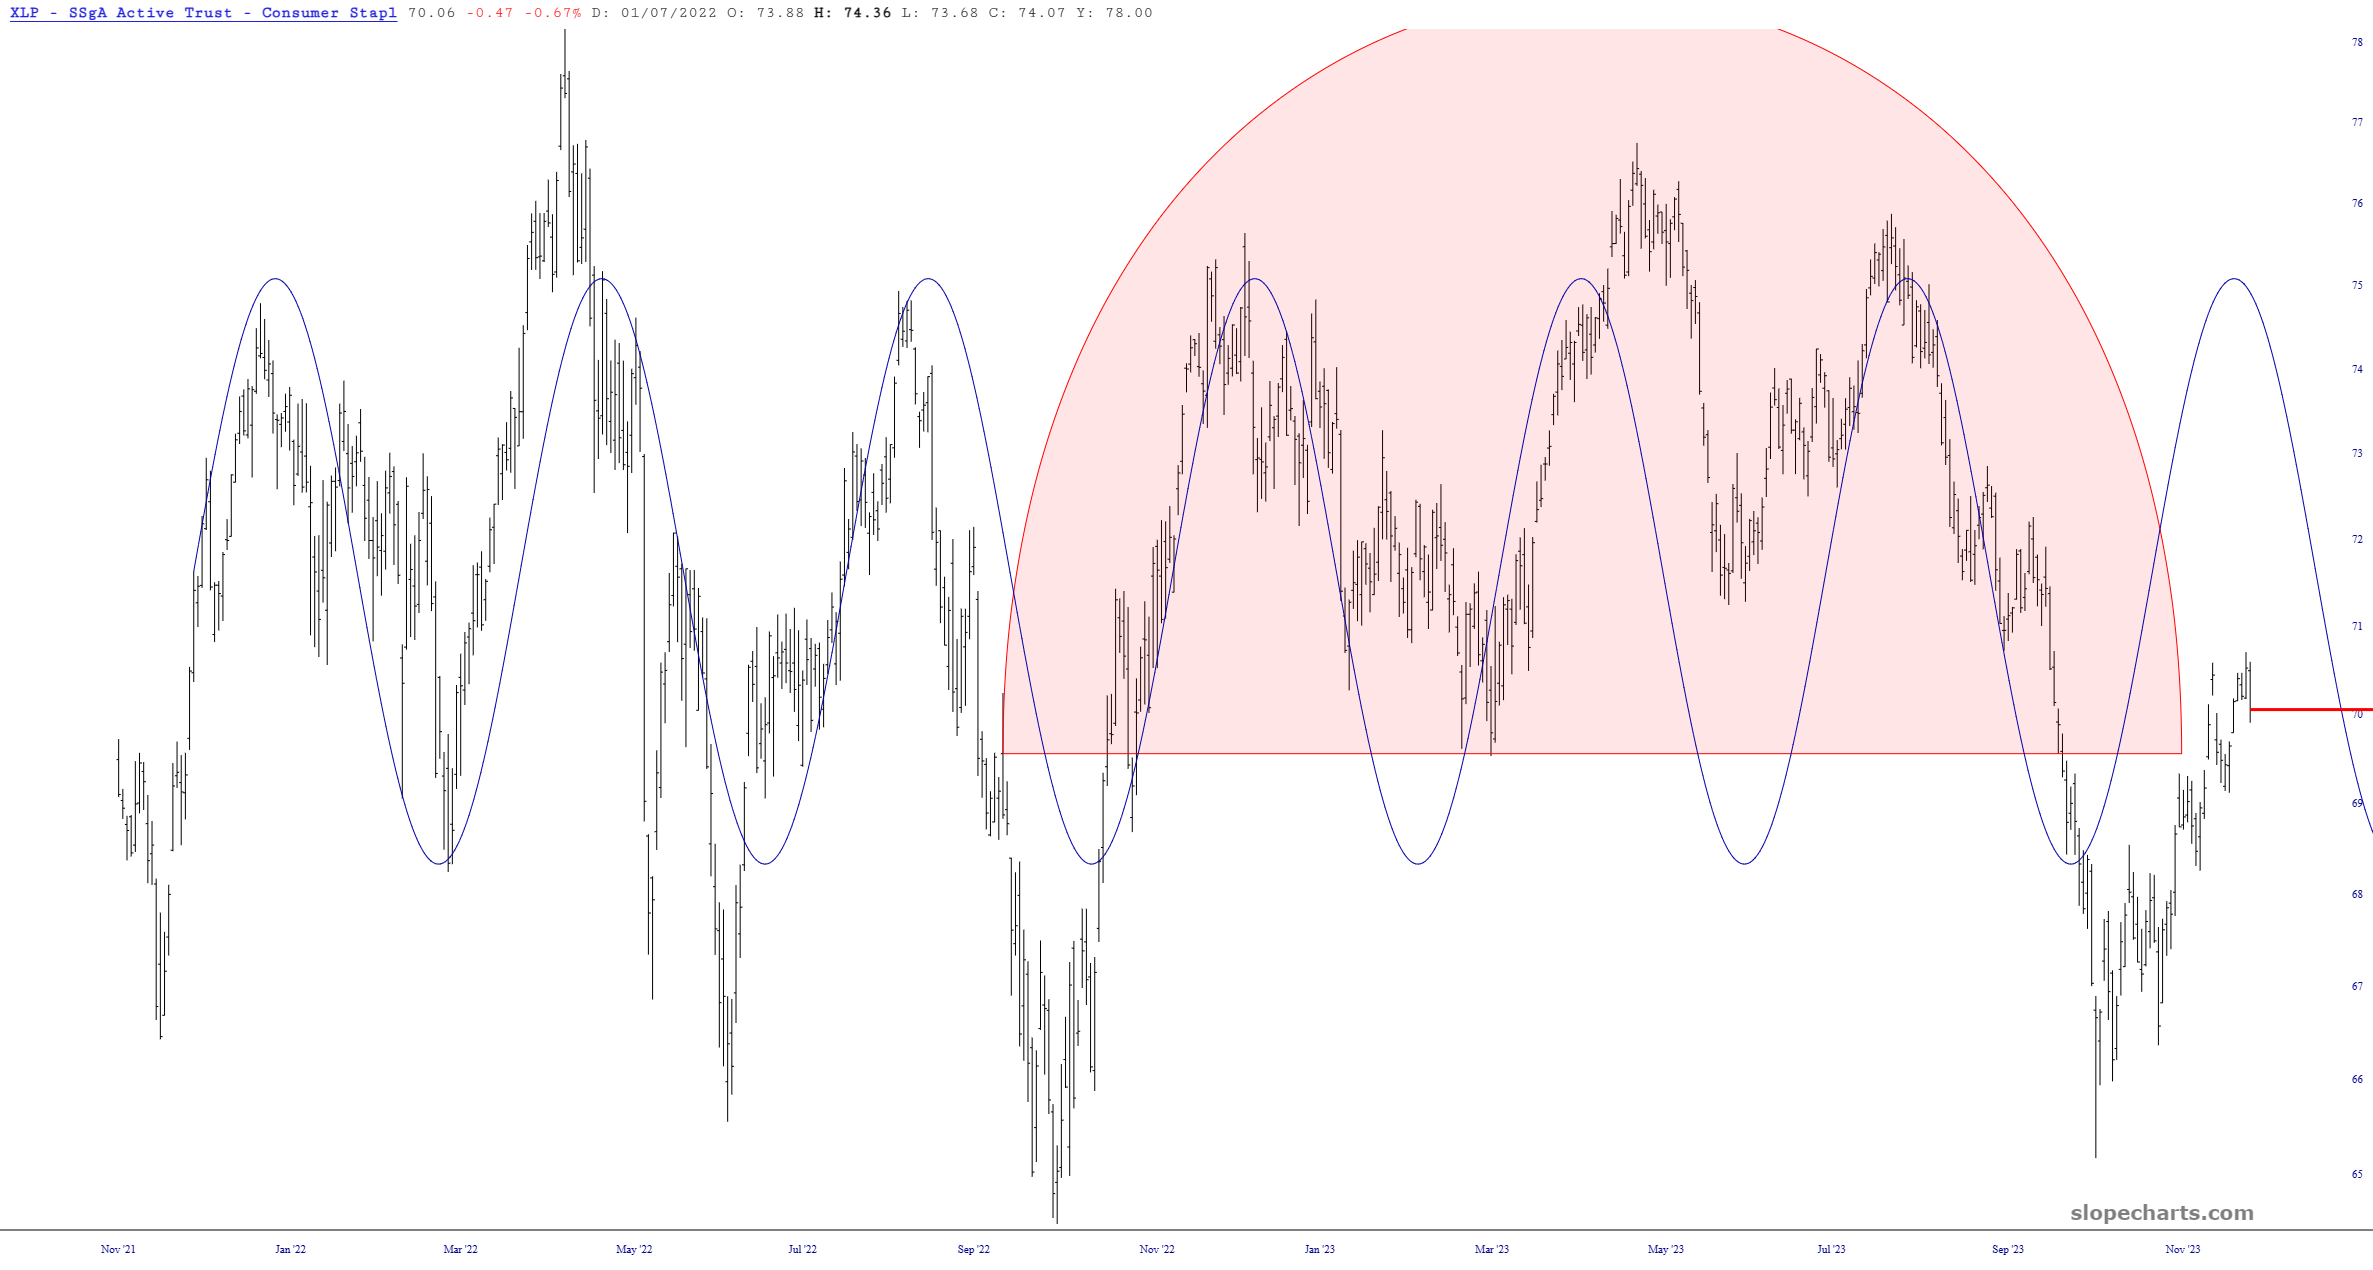
Will Staples Bend?
It looks like Consumer Staples (XLP) has reached peak strength on its sinewave. Will it start to weaken at this point? I’m thinking so.
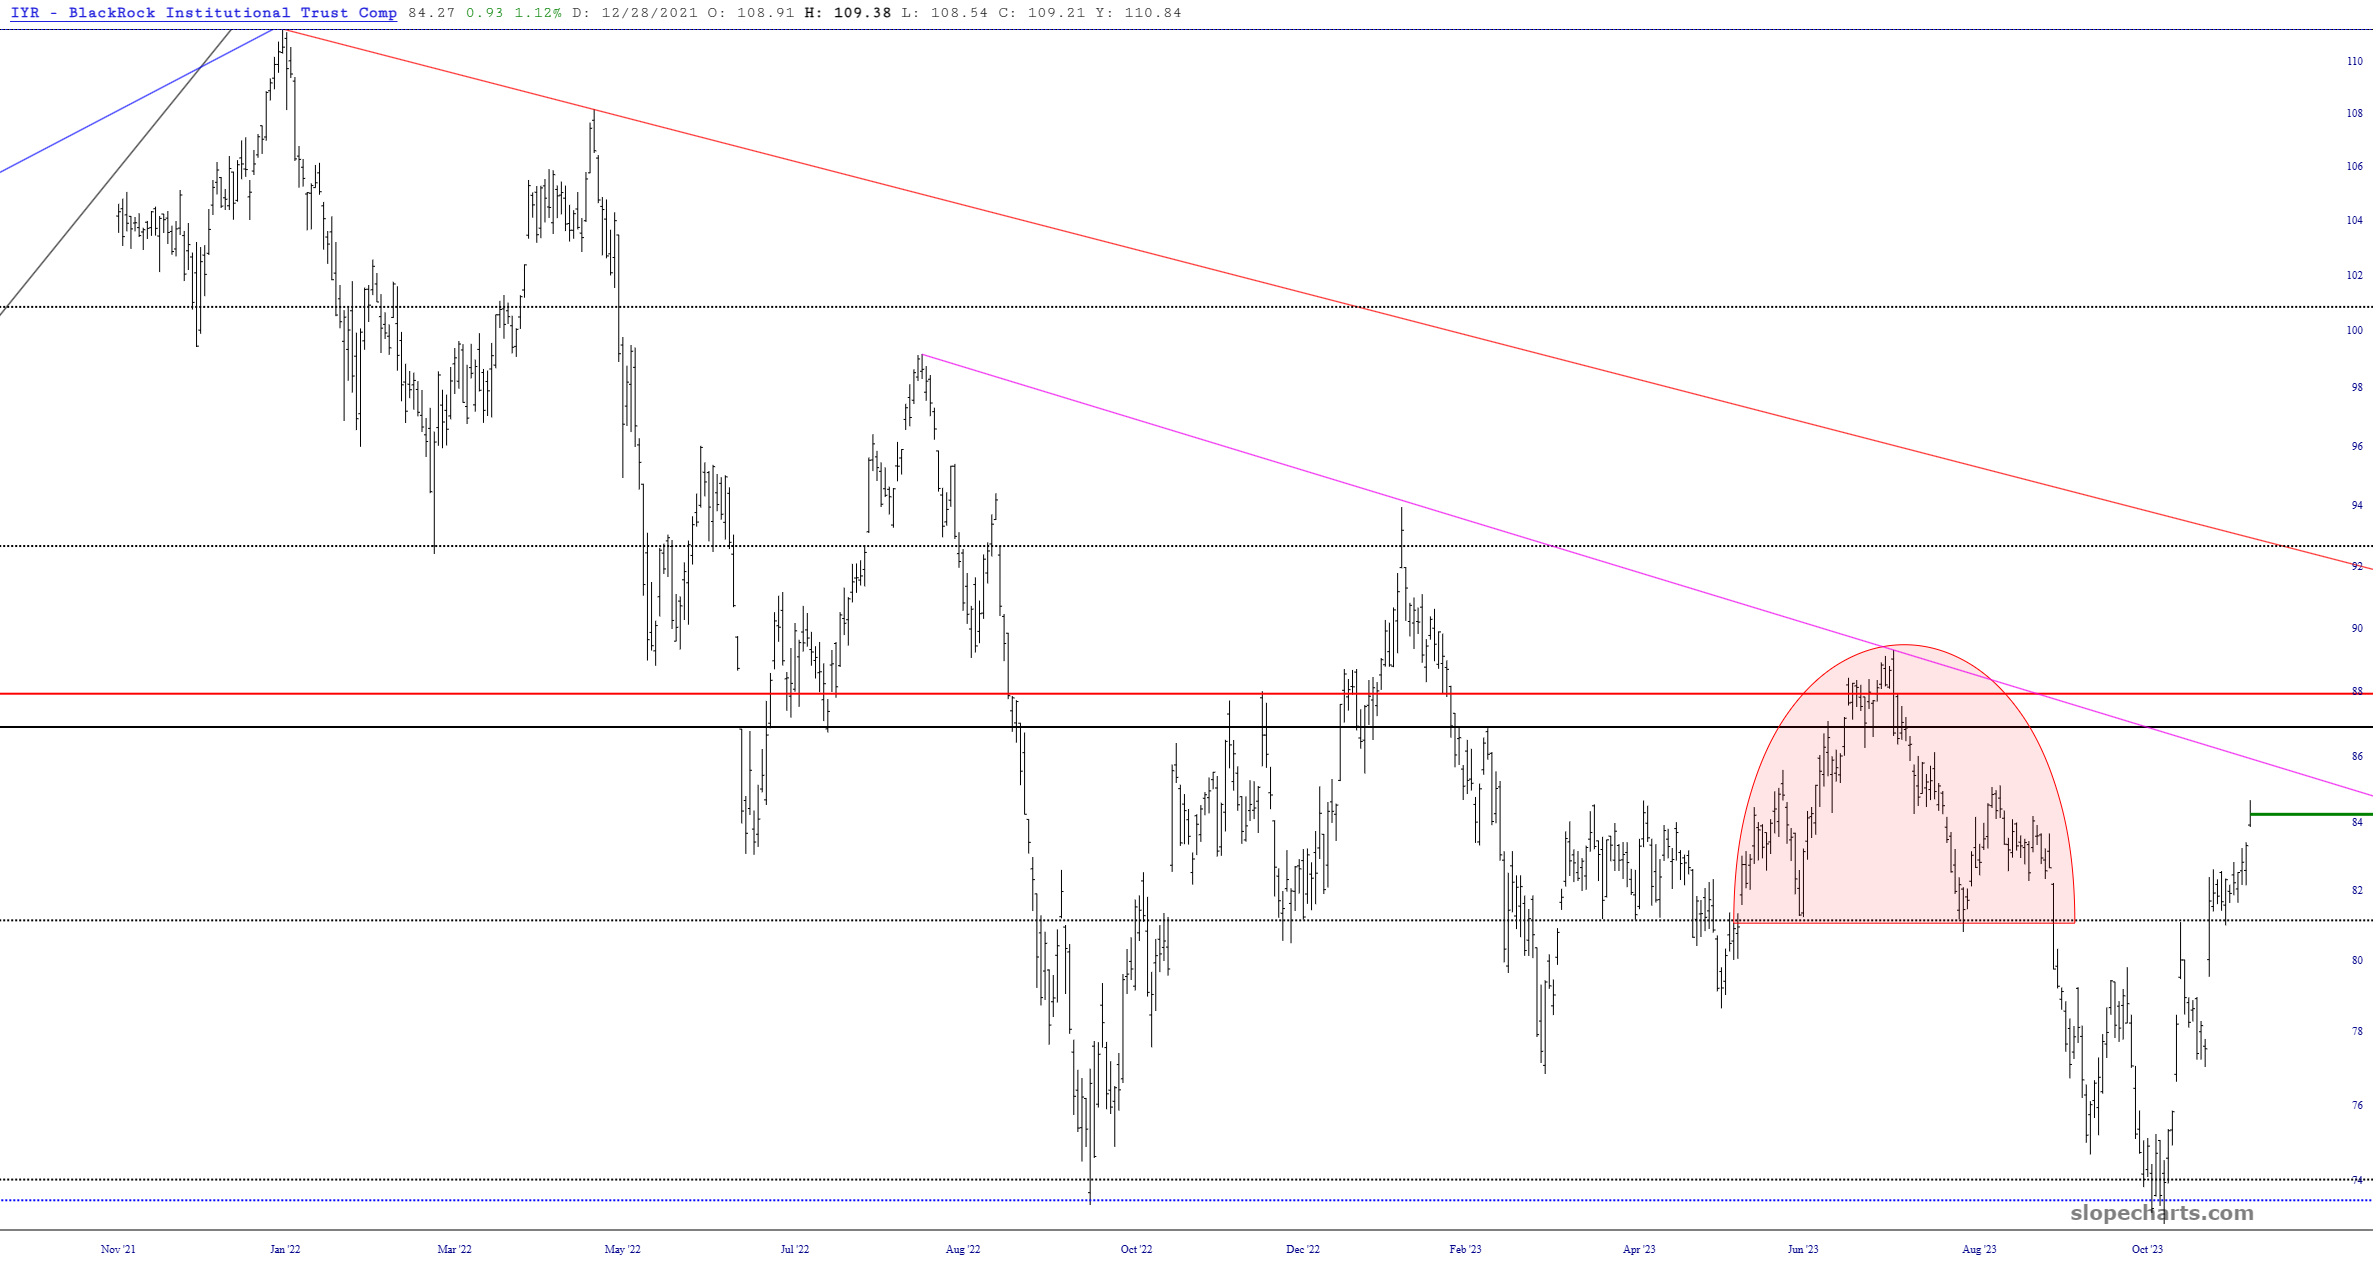
Runaway Real Estate
How much longer can this beast fly higher? I’m thinking not much longer. Look at the trendlines I’ve drawn on the symbol below, IYR. Major resistance is coming up quickly.
Yet Another Sinewave
Not that long ago, I never, and I mean never, bothered using the sinewave tool on any chart. These days, I’m becoming increasingly intrigued by the financial instruments which seem to conform to some kind of steady rhythm, and it turns out that my favorite ETF, the utility symbol XLU, has an intriguing relationship with this as well.

