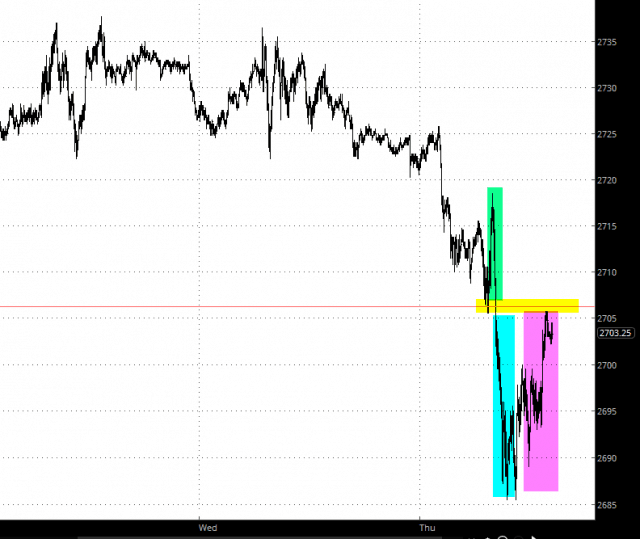
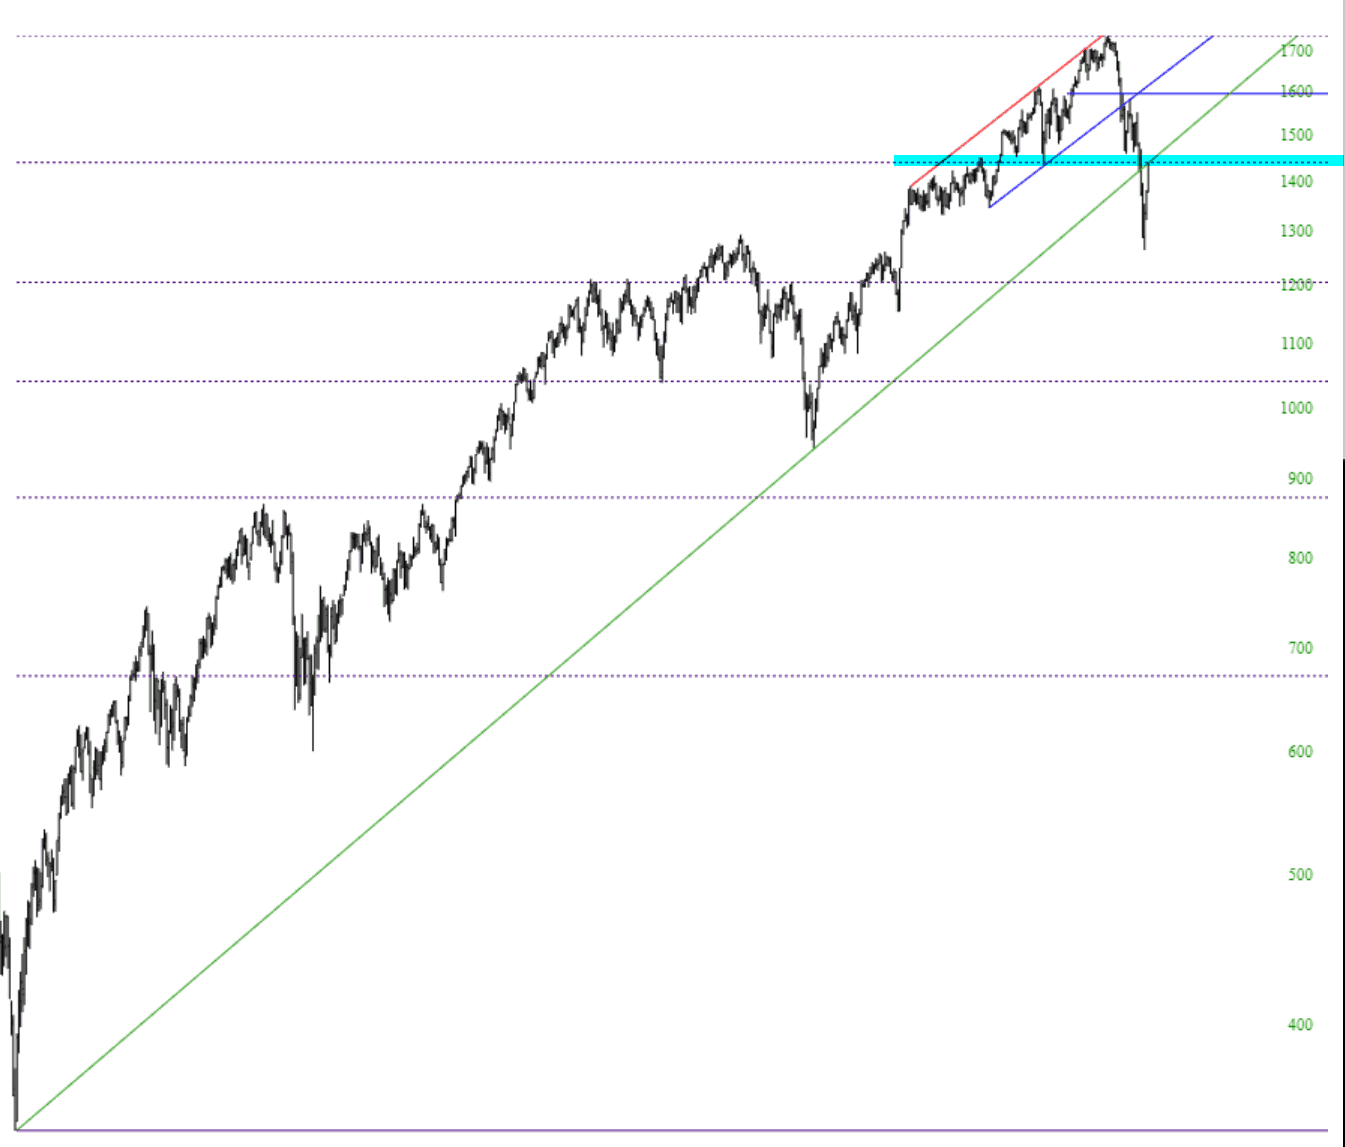
Just as the Super Bowl was a dud to watch (sorry Patriots fans, that game was terrible), this upcoming week may bring a dud for bulls in Apple ($AAPL).

Slope initially began as a blog, so this is where most of the website’s content resides. Here we have tens of thousands of posts dating back over a decade. These are listed in reverse chronological order. Click on any category icon below to see posts tagged with that particular subject, or click on a word in the category cloud on the right side of the screen for more specific choices.
The S&P 500 (SPX) is right at a price zone pointing more towards a meaningful give-back in the short-term. This zone of resistance can be viewed through the Fibonacci price and time relationships on the daily SPX chart.
As the chart shows, as of Friday’s close, the SPX resided approximately 16% above its late December lows, amounting to an exact 62% Fibonacci recovery of the entire prior decline from the Sep 21 all-time-high at 2940.91 to the Dec 26 low at 2346.58.
This is yet another “wow!” moment for me. I present to you below the financials ETF, symbol XLF, with a Fibonacci retracement laid on top. I was quite excited to see the result, which is similar to what we’ve seen with the Russell 2000. The retracement is spot-on!

Ever since Jerome Powell demonstrated he has absolutely no backbone, and is far, far more concerned about having his feelings hurt by a mean tweet than he is about the long-term stability of the United States, the equity markets have been on an explosive ascent.
I would like to quietly point out something that 99.9999% of people are unaware of, which is the Fibonacci retracement spanning the entire decade-long bull market of the Russell 2000:

It’s really, really, REALLY easy to be a bear when the market is in a free-fall. Everyone loves you. You get bottles of booze in the mail. You get love letters. The whole schmear.
At times like this, the entire world hates you. (well, more specifically, me). I am, once again, the only equity bear walking the planet. Billionaire fund managers, pundits, analysts, and everyday Joes are stock-crazy once more. Everything is going up. Trump and Powell will save us. China is our friend. And so on.
I’ll humbly offer you this long-term chart of the Russell 2000 with its Fibonacci retracements:
