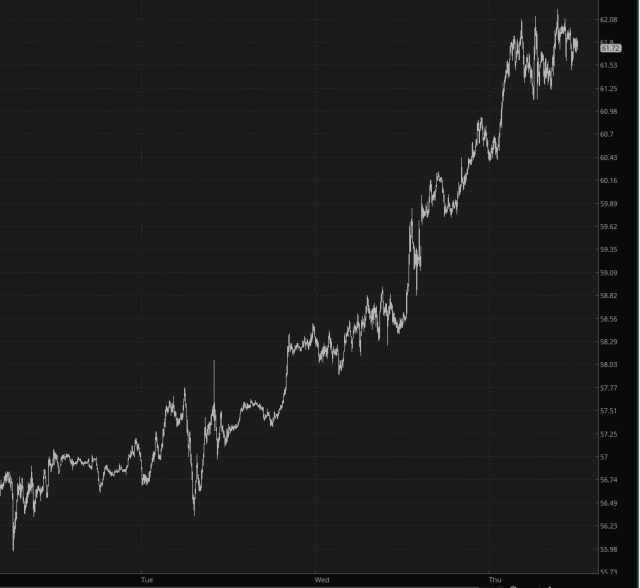
Celebrated chartists such as I are able to look at the chart below and draw conclusions from it without assistance from any human or AI system. The chart is crude oil and the trend………is UP.
Thank you. I’ll be here all week.
Slope initially began as a blog, so this is where most of the website’s content resides. Here we have tens of thousands of posts dating back over a decade. These are listed in reverse chronological order. Click on any category icon below to see posts tagged with that particular subject, or click on a word in the category cloud on the right side of the screen for more specific choices.
Celebrated chartists such as I are able to look at the chart below and draw conclusions from it without assistance from any human or AI system. The chart is crude oil and the trend………is UP.
Thank you. I’ll be here all week.
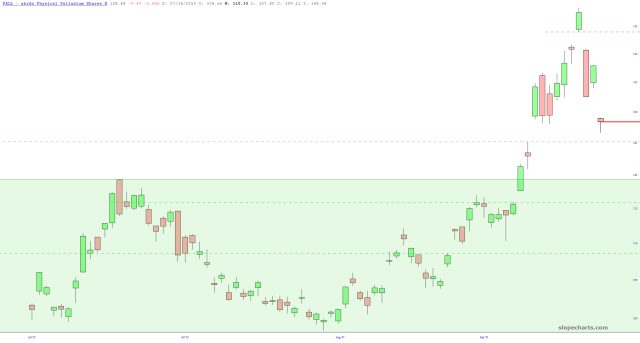
Yesterday, I came THIS close (holding fingers very closely together) to buying PALL (the palladium ETF) only because I want to own this and figured that it was at least cheaper than it had been a couple of days prior. Luckily, the moment I glanced at the gold and silver charts, I dropped that notion, because it’s going to be a while before precious in general is cheap enough to be appealing. (Indeed, /PA was smacked down about 7% earlier this morning).
I presently have 24 short positions. Four of them are specifically based on price gaps, and they are shown below. Click on any image for a much bigger view. The arrow marks the gap, and the tool tip (black rectangle) shows the price level of the gap itself. My stop-loss orders are a little above these levels.
Halliburton (HAL) is blasting higher today toward its price gap at 24.62. May I suggest shorting HAL with a stop loss a little above that level? I may? Why, thank you!

I’ve long held that rates are heading much, much lower, and for a long time. Why? Because the economy is heading for a dumpster. And, as God intended, down they go…………

