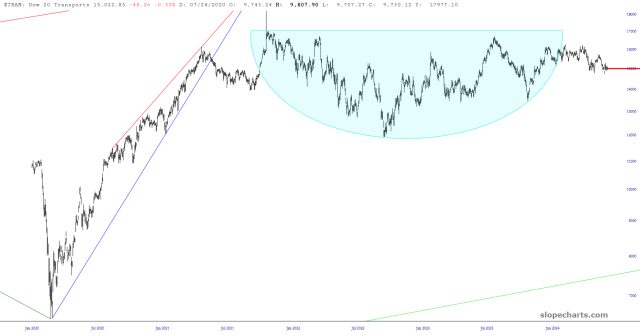
TER green line is 2009 bull market support. ASML also 2009 bull market support below. Big gap that is 14% lower, with more gaps below.

Slope initially began as a blog, so this is where most of the website’s content resides. Here we have tens of thousands of posts dating back over a decade. These are listed in reverse chronological order. Click on any category icon below to see posts tagged with that particular subject, or click on a word in the category cloud on the right side of the screen for more specific choices.
TER green line is 2009 bull market support. ASML also 2009 bull market support below. Big gap that is 14% lower, with more gaps below.

The Dow Transports ($TRAN) doesn’t get much attention, but I’d like to change that briefly. Take a look at the chart below, because it’s quite interesting.

What I see is as follows:
I think what’s next is a resumption of the weakness.
It’s quite clear that the heady, new-highs-every-day insanity ended on March 28th. Since then, in stages, things have begun falling to pieces. Here, for example, the NASDAQ Composite has utterly busted its ascending channel and has instead completed a distribution range from which it has already broken.

I am absolutely delighted to see this sector getting destroyed. Medium-term target is the green line.

Let ’em burn.