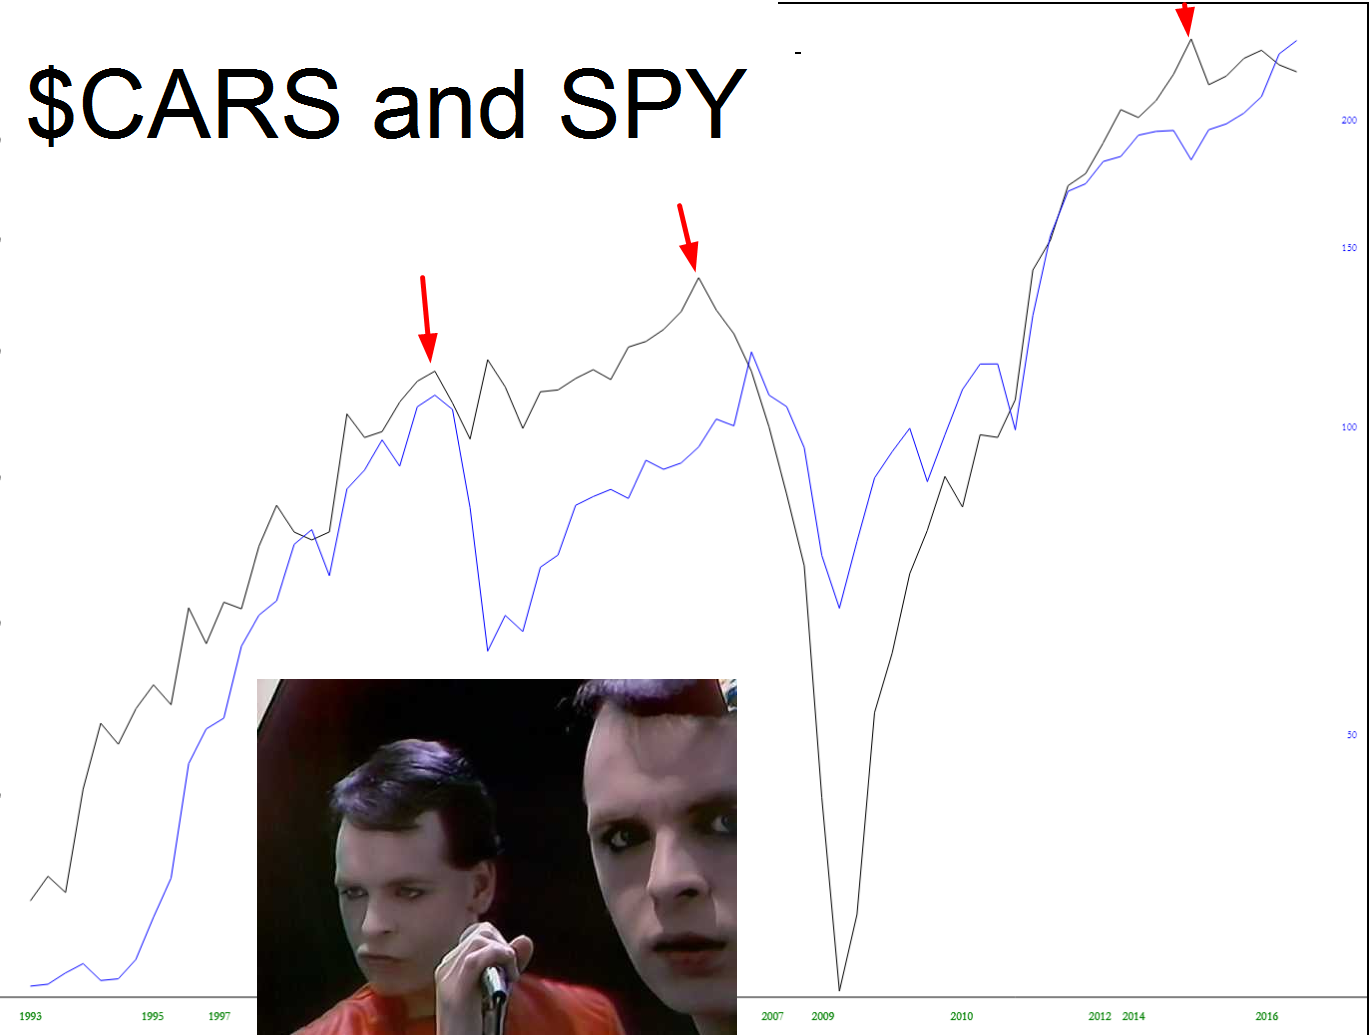
I was messing around with SlopeCharts, as I so often do, and I stumbled across one of our more unusual indicators – $CARS – which shows motor vehicle production. I overlaid it with the SPY and saw a mildly-interesting phenomenon in which car production peaks and rolls lower before stocks do. Like I said – meh – mildly-interesting.
Slope of Hope Blog Posts
Slope initially began as a blog, so this is where most of the website’s content resides. Here we have tens of thousands of posts dating back over a decade. These are listed in reverse chronological order. Click on any category icon below to see posts tagged with that particular subject, or click on a word in the category cloud on the right side of the screen for more specific choices.
Analog Video
The sad irony of this week is that I have a relatively huge amount of time and almost nothing to write about (To describe the market as “boring” is akin to describing Mitch McConnell as “not classically handsome”; in other words, a massive understatement. Because January is going to be oh-my-God, constantly-traveling busy, and I’m sure the markets will be very interesting. Anyway, here’s another video I just cranked out, which talks about analogs and their value. I’m going to spend the rest of my day doing voiceovers for the other 21 videos.
Gentlemen Prefer SlopeCharts
I’m not sure how you spent your Christmas weekend, but I can tell you how I partly spent mine – – making twenty-three short informational videos about SlopeCharts (Yes, that is my idea of a vacation). I’m making all kinds of new content for the new Slope of Hope, and you can expect to see me drop in these little videos in the coming weeks partly as filler, partly to help spread the word, and partly to help people understand the product better. I’m spending my day doing the voiceover for them now, so here’s the first.
My Christmas Gift to Slopers
Merry Christmas, Slopers! And in the giving tradition, I have a gift for you………Study Sets in SlopeCharts! Study Sets are time-savers built into SlopeCharts which allow you to apply multiple studies, with customized values, instantly. You access them the same way you do any technical indicators – by clicking the Studies button – and on the extreme left of the dialog box you will see the choice for Study Sets. (You can also save a set without going to Study Sets just by clicking the Save Set button).
SlopeCharts Default
Hi, everyone. I just returned from seeing Darkest Hour, and it was every bit as good as I hoped. Oddly, most of the folks in the theatre were geriatric, so I guess movies with WW2 themes still appeal to an older crowd – – but it was a real pleasure to watch.
On an utterly different note, it occurred to me that it’s rather odd (particularly for newcomers) that SlopeCharts appears on the screen without………well……..a chart. Instead, it’s just a big blank space. Therefore, I’ve made it so that the symbol SPY shows up by default. You’re not stuck with this, however. If you’d like to use something else (like, say, $BTC), you can change this in Preferences:


