My broker can find stock for me to short 99.5% of the time, but in this case, there isn't a single share of MUB around. I think muni's are heading for the dumpster, so if anyone knows another instrument – or an inverse ETF – to take advantage of this, I'm sure we'd all love to hear about it.
Slope of Hope Blog Posts
Slope initially began as a blog, so this is where most of the website’s content resides. Here we have tens of thousands of posts dating back over a decade. These are listed in reverse chronological order. Click on any category icon below to see posts tagged with that particular subject, or click on a word in the category cloud on the right side of the screen for more specific choices.
American Binge and Purge
I pretty much gave up on retail ETFs like XRT and RTH, because my bias against shopping culture is so extreme. I find the entire obsession with consumerism to be vile and grotesque. So I simply note with disdain – and no financial interest – the lifetime high in XRT today.
The Crossing
During bubbles, we cynical/discerning/skeptical folks increasingly have one thought dashing through our swelling, itchy brains as we watch those participating in the party: "This doesn't make sense. Something is wrong with them."
And the bubble gets bigger. "This doesn't make sense. Something is wrong with them." We stand outside the window, staring inside, and the party just gets more fun. More booze is carted in. Strippers show up. People are hanging off chandeliers.
"This doesn't make sense. Something is wrong with them."
And, after a certain amount of time, depending on the observer, there is a shift: "This doesn't make sense. Something is wrong with me."
At this point, a decision has to be made. The observer decides he is wrong, steps away from the window, and goes inside to join the party; or the observer accepts that perhaps there is something wrong with him, but logic still forecloses him from walking inside.
What happens once this crossing takes place? Who knows. Maybe the party goes on for a while longer. Maybe the observer has such rotten timing that, after he's missed all the fun, everyone dancing around nude suddenly contracts syphilis the moment he walks in the door.
I have felt myself at this crossroads lately, particularly as every other bear on the web has given up any hope of a big downturn and the most dramatic drop is maybe a few percent. I know that our friends in Gainesville have offered three (!) different scenarios for what's next, including, almost as a postscript, the remote chance of a big drop, but I think that's in there just as an insurance policy for future marketing efforts.
The fact is, the bears have given up. Period. Every one of them. Believe me, because they send me emails about their views, and they've thrown in the towel.
This came to mind over the past 24 hours because of what's happening in Ireland. The Irish finally gave up, accepting the fact their economy is a total basket case, and went for a bailout. The market's reaction, naturally, was to rally boldly on the news. All asset classes zoomed skyward.
So what's accepted for fantastic news these days is an important industrialized country affirming that it's in financial ruins and accepting the 2,387th giant bailout package to forestall the inevitable.
And that's when the thought appears: "This doesn't make sense. Something is wrong with me."
When I woke up this morning – far too early, as usual – I glanced at my iPad, and I was surprised to see that not only had the huge Euro and ES gains vanished, but they were now losers. As I'm typing this, the ES is down five points – a 12+ point reversal from just hours ago.
It will be interesting to see where this party eventually winds up. I'm still betting on syphilis.
Bullish Reversal Patterns (by Springheel Jack)
The market often reverses with only subtle and ambiguous signals, but every so often it reverses direction with a series of reversal patterns so clear that the reversal seems to be written in the sky in letters of fire. Today is one of those times, and while it may be that the bullish patterns will fail, I have rarely seen a bullish reversal setup that looked so wide ranging, and so clear, than the one we're looking at at the start of this week.
I am still a little cautious here, because in the bigger picture we are at a key resistance area on many charts, and I posted some of those for a weekend post that are well worth a look. However on many other charts, long term and worldwide, that resistance area has already been broken, and we've been retesting broken resistance over the last two weeks. We might yet go down here, but on the balance of probabilities I think we seem likely to rise further, and the bullish pattern setup this morning on numerous indices looks likely to resolve upwards after a dip today.
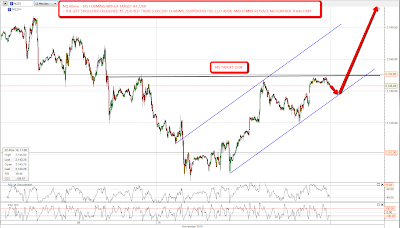
On ES we matched the high from a few days ago in overnight trading, and a very nice looking IHS is forming with a target in the 1241 area. I have trendline rising support in the 1194 – 1196 area and that looks the most likely target for the right shoulder to bottom out:

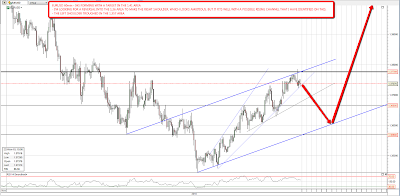
On NQ (Nasdaq) we have another nice looking IHS forming with a target in the 2208 area. The left shoulder bottomed at 2120 and that is a possibility for the right shoulder too, especially as that has been an often visited support / resistance area in the last few days. I do also have a nice looking rising channel with support in the 2136 – 2138 area though, and it's possible that the retracement may bottom there:
I watch silver carefully as an indicator for equities direction and on silver we have another nice looking IHS forming with a target in the 30.8 area. The left shoulder troughed in the 26.5 area, and that is a target for the right shoulder too, but I have another nice looking rising channel on silver, with an unproven lower trendline, and if we should bounce there, then silver should find support in the 26.8 to 27 area:

USD direction is something I'm always watching for market direction and I generally use EURUSD as a proxy because it's 55% of the USD index. On EURUSD we have yet another nice looking IHS forming with a target in the 1.41 area. The left shoulder troughed in the 1.357 area, and that's looking ambitious for the right shoulder but that level has been an important support / resistance area and it could make it back there. I have a nice looking rising channel on EURUSD that would fit with a retracement that deep. I have a smaller rising support trendline in the 1.368 area though, and that could hold the retracement:
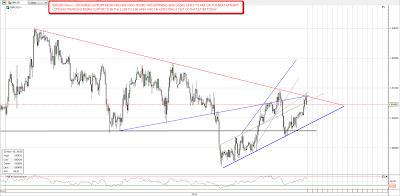
GBPUSD stands out from the other charts that I'm posting this morning, if only because there isn't a large IHS forming on it. Declining resistance from the high was tested this morning, and held, but looks likely to break on the next sweep up. Short term there is a triangle forming on GBP with the next support in the 1.598 area, and there is a risk that this triangle may break downwards today towards a target at 1.584 if EURUSD does retrace deeply to make the right shoulder on that:
So there we have it, a very nice series of bullish reversal patterns to start the week. They may not play out of course, and any pattern can fail to complete or play out to target, but momentum is with the bulls as it stands here, and this looks likely to me to resolve upwards this week after a dip to make the right shoulders on all of these patterns today.
