Early last month, I pointed out the very nice topping pattern in Kirkland's. It's working out quite nicely this morning:
Slope of Hope Blog Posts
Slope initially began as a blog, so this is where most of the website’s content resides. Here we have tens of thousands of posts dating back over a decade. These are listed in reverse chronological order. Click on any category icon below to see posts tagged with that particular subject, or click on a word in the category cloud on the right side of the screen for more specific choices.
SPX Higher High Roadmap (by Springheel Jack)
As I was expecting SPX and Nasdaq broke declining resistance from the recent highs yesterday, and it is therefore now more than likely in my view that the recent retracement has bottomed and that we are either in the dying stages of wave 4 correction or in the early stages of a wave 5 up. The next milestone on ES is to make a higher high than the recent high at 1205.75, and a promising pattern setup has developed since the high yesterday that may well deliver that.
In the short term a rectangle has developed on ES. This is a bullish pattern that breaks up 69% of the time, and these patterns are a particular favorite of mine. The rectangle target is in the 1206 to 1206.5 area, and on a break up I'd expect to see that made. While it lasts there are some nice entries and exits playing the range within the rectangle which is 1194 – 1199.75. Now the 1206 area is a very significant one because as well as being the area of the recent high, it is also the neckline for a potential IHS indicating to the 1241 area. If this were to play out ideally we would see the rectangle play out to target at the neckline, then a reversal to make the right shoulder with a target in the 1191.5 area, and then a break of the neckline with a run up to the IHS target in the 1241 area. That target area is also the target area for the large IHS on SPX that formed in the summer of course. Here's how that might look on the ES 15min chart:
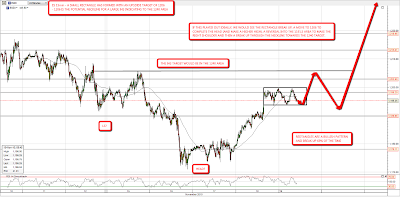
If the ES rectangle breaks downwards, which they do 31% of the time of course, the downside target would be in the 1188 ES area, and the potential IHS would still be in play, but we'd lose the nice pattern setup to deliver it that I'm seeing at the moment.
In terms of other indicators of market direction, silver has been coming along very nicely from a bullish perspective. It rose 5% yesterday against 1% for gold, so the gold:silver ratio dropped heavily which is very bullish. It has also cleared the initial upside target that I was watching, which was the upper trendline of the potential declining channel that the broken falling wedge might have evolved into. Rising and falling wedges often evolve into rising or falling channels so that is always the first target to watch. As silver has now cleared that trendline the falling wedge target measures back to the recent high over $29 and, in practical terms, new highs from there. Here it is on the silver 60min chart:

On the forex front EURUSD is also looking bullish, and broke declining resistance from the high yesterday. An IHS has also developed with the neckline broken overnight, and the IHS target is in the 1.385 area:
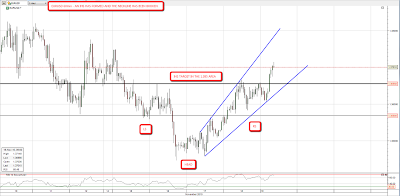
Now obviously the Euro has problems, and the Irish bailout is in the news at the moment and dragging on it somewhat. That is a concern and casts some doubt on whether my ultimate upside EURUSD target in the 1.45 to 1.50 area can be made. I think that's missing the point though, as many currencies have significant issues at the moment, and in the Euro's favor it doesn't have a central bank committed to devaluation and a huge expansion of the money supply like the US. Forex beauty contests at the moment are composed mainly of ugly stepsisters, which is the reason gold is doing so well as an alternative store of value that can't be debased by well meaning fools with PhDs.
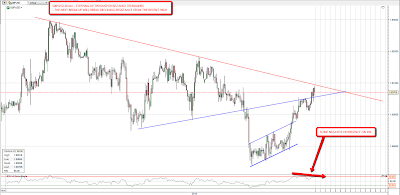
On GBPUSD there has also been an impressive rise, with a step through the first significant resistance trendline overnight. GBPUSD is currently stalled at the declining resistance trendline from the recent high and there's some negative divergence on the 60min RSI so we could see a significant retracement here. Here it is on the 60min chart:
I was looking at oil last night and that's also looking bullish, with a gently broadening ascending wedge that has developed with the next upside target in the 90 area (Jan 2011 e-mini futures). Support is in the 80.4 area and looks fairly solid with three touches on the support trendline. I know Carl Futia is bearish on oil (while bullish on SPX after a further fall to the 1130 – 1150 area), and that's because the intermediate term supply / demand fundamentals stink. The supply / demand fundamentals have stunk all the way up from $30 though, so that's not an immediate cause for concern, and the risk/reward on oil looks pretty good here. Here's the wedge on the daily chart:

On Carl Futia's view that this retracement isn't finished, he could be right, though obviously I disagree on the basis of what I'm seeing at the moment. From my perspective, a retracement that went to 1130 – 1150 would break a lot of key support levels and might also carry USD up through declining channel resistance. That would cause enough technical damage that this would no longer look like a wave 4 retracement, and much more downside would be opened up as a result. That's possible, but it doesn't look probable to me right now, though we'll only know for sure when we make a new high on SPX of course.
Gap Rally? Done.
A couple of days ago on my video, I talked about my hope that the market would "rally to the gap". Yesterday, it made baby steps, and today, it made its big move skyward.
Pretty much all the intraday graphs I follow look like the one below – – a low on Tuesday, and a lurch higher just underneath that tinted area, which for me represents important resistance.
I imagine the bulls are pretty pumped-up about today's GM-driven action; I would be too. Indeed, I was quite grateful to enter the day with a large EEM and FXE position. However, recent market action still remains a series of lower lows and lower highs:
As I mentioned early today, one of the nicest short set-ups was the real estate ETF symbol IYR; this performed pretty well for me today, in spite of the nearly 200 point rise in the Dow.
Now obviously if the dollar rolls over hard again (Bernanke will be making a speech in Europe, which will be in the wee hours of the morning here), maybe the bulls will simply run this market higher. I've been kind of stunned at how some former permabears are projecting new highs. Atilla has called for the /ES to move to as high as 1350, whereas even the fellows in Gainesville are calling for a push to new recovery highs before things roll over (they actually lay out three possibilities, which kind of makes it difficult to be wrong, but the new recovery highs seems to be their top choice).
So the record bullish sentiment seems to have affected everyone, including the most bearish of the bears on the web. For myself, I've lightened up on the bullish side – I'm at about a 15/85 split right now – and my portfolio is a tad light, at about 85%. Friday is dead quiet on the news front, so it'll be interesting to see if the market pads Thursday's gains or if we start rolling south again.
I don't really have anything else to say, so that's probably it for Slope for today. I'll see you in the morning!
This is EVERY Marketing Presentation I’ve Ever Seen
