Slope of Hope Blog Posts

Slope initially began as a blog, so this is where most of the website’s content resides. Here we have tens of thousands of posts dating back over a decade. These are listed in reverse chronological order. Click on any category icon below to see posts tagged with that particular subject, or click on a word in the category cloud on the right side of the screen for more specific choices.

Wild Thing (by Springheel Jack)

By -

Looking at equities over the last few months, I'm sure the same question occurs to many of us. Can anything stop this wild thing from rising before QE2 finally finishes in June? That's a good question, and no-one knows the answer to that for sure. What we do know though is that there is a solid resistance trendline on SPX that has held so far since this moon shot started in late August, and that we're now just below it again. Until that trendline breaks it has to be regarded as the rising ceiling on SPX, and there is increasing negative divergence on the daily RSI that is suggesting that it shouldn't be broken now:

Looking around the other indices the Transports index is still a long way from confirming the recent highs on Dow:

The SPX is leading now, with Nasdaq and the Russell 2000 trailing behind.On IWM (Russell 2000) the broken support trendline has been acting as effective resistance:

One chart that sprang to the eye this morning as I was browsing through my indicator charts was the weekly chart for the Baltic Dry Index, which is in a very ugly place, and looks as though it might soon test the crash lows. The divergence between the BDI and the Transports index is very glaring. Interesting, though I don't think that it tells us a lot other than to say that over-ordering of new ships near the top of the last bubble has led to massive overcapacity now. Still, shippers with low debt might be an interesting long here:

There's not a lot in terms of interesting short term patterns this morning. NQ broke the broadening descending wedge on Friday and made the pattern target overnight, oil may be forming an H&S to resume the decline that was firmly established before the riots in Egypt the Friday before last, and obviously we're just below resistance on a number of indices. The most interesting thing I'm looking at this morning is on AUDUSD, where a serious support break is in progress, and we could well see a 200 pip drop to the support trendline within the current broadening ascending wedge:

Mondays have been very bullish lately and I'm doubtful about seeing any significant downside today. Unless we see resistance break on SPX however, I'm leaning bearish for this week.

COT Report Week Ending 2/1 (by Ultra Trading)

By -

Some mixed messages come out of this week's CFTC Commitment of Traders Report. Below are six charts with my best estimate of what the data is telling us.  The three key takeaways are


  • Commercial traders appear positioned for further bond weakness
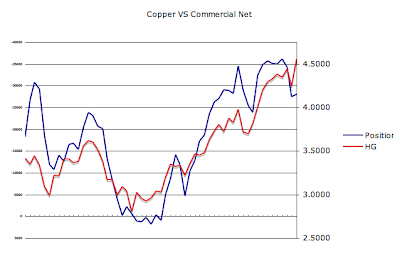
  • Commercial traders are reducing net short positions implying copper weakness 
  • Retail traders are positioned for further USD weakness, implying USD strength


Bonds

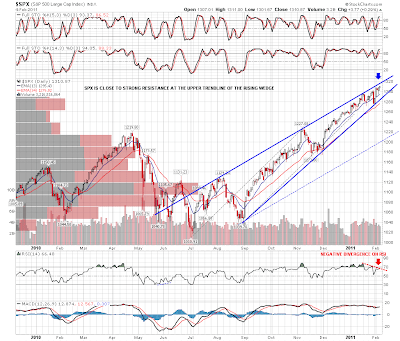
Looking purely at the relationship to 30 year yield and the SPX, this chart implies that further bond weakness (lower price higher yield) would be a positive for the SPX.  This cannot be taken purely at face value though.  There are many implications to a weakening bond market beyond this chart.  Still, the data below would imply continued equity strength.


Bonds – Commercial Net

Commercial positions continue to move towards a more net long in the face of 30 year weakness.  At face value this chart would imply further bond weakness to come.  It's important to note though that commercial positions are approaching a 52 week high.


USD – Commercial Net

This is a tough one to read.  The commercial trader position is net long and matches that of the prior 52 week high.  It is very possible their net long position grows but considering this position relative to the prior 52 weeks, it is quite possible they begin getting more short which would imply USD strength.  The USD has bounced off key support which would further argue for a reversal to a more short commercial net position.


USD – Commercial VS Retail Net

This next chart is that of the non reporting positions versus commercial positions.  Non reporting (retail) are relatively short versus prior times in the year so there is fuel for a short squeeze in the USD.  Hard to make any definitive call though.


Copper – Commercial Net

This is a rather interesting chart.  Copper caught a nice bid the past week yet the commercial traders are not buying it (literally).  They appear to be getting more net long (this  chart is inverted for comparison sake) which would imply pending copper weakness.


Copper – SPX VS Commercial

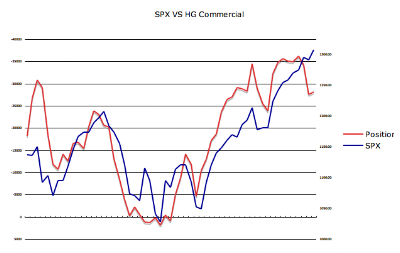
Nothing too definitive can be drawn here other than a word of caution for the SPX as commercial positions appear to becoming more net long (chart is inverted for comparison sake).


Submitted by Ultra Trading. If you would like to read more, please visit my blog - Ultra Trading