Which, I would surmise, implies that inflation risk is gaining strength as well.
Slope of Hope Blog Posts
Slope initially began as a blog, so this is where most of the website’s content resides. Here we have tens of thousands of posts dating back over a decade. These are listed in reverse chronological order. Click on any category icon below to see posts tagged with that particular subject, or click on a word in the category cloud on the right side of the screen for more specific choices.
Surfin’ USA (by Springheel Jack)
Trading is like surfing in a way. You wait for a promising wave, you pick your entry carefully, and then you ride it as far as you can. It's a process that requires self-discipline, patience and skill, and inexperienced surfers and traders tend to make a lot of mistakes. I was saying to someone yesterday that the bear setups that I write about when they appear are inherently riskier plays in this cyclical bull market, and that they need to be played cautiously and with an awareness of the shorter and longer term pictures. When they play out though they can be very profitable and set up great buying opportunities at the end of the move.
I've been getting some suggestions this week that I shouldn't write about bear setups as they form, because they distract less experienced traders from the longer term long opportunities in this POMO-driven bull market. Perhaps, but I chart what I see, and it would be dishonest to just paint a bullish picture & chant JBTFD every day as though that was genuine technical analysis rather than just a currently safe medium term mantra for trading rookies. I'll chart and blog what I see, and readers can take it or leave it as they wish.
I'll be posting an unusual seven charts today as there are a lot of very nice looking setups this morning. The first chart is NQ, where the strong resistance trendline was broken yesterday morning before a bounce back into the wedge to test 2400 resistance. NQ is trading under the broken trendline now and I'm hoping to see 2400 tested under the broken trendline today as that would likely offer a very nice short entry:

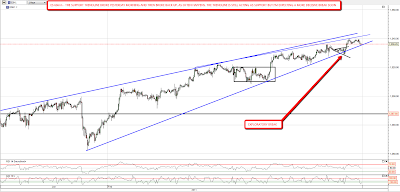
On ES the picture is subtly but importantly different. The support trendline was also broken there yesterday but after the break back up is still acting as support. I'm not expecting that to last long , but we might well see another move up within the shorter term rising wedge I've marked up on the chart:
There's a mixed picture on other instruments / indicators today. Copper is trending and reversing beautifully at the moment and is offering some really nice short term opportunities. It reversed up yesterday and then down overnight. I'm expecting a main channel support test in the 441 area soon, very possibly today and while I'm expecting a bounce there initially, copper may well break down through it afterwards, opening up a lot more downside:

Silver made new highs yesterday and looks like an interesting, if suicidally brave, short opportunity this morning. I'll cover that another day as I'd like to add the longer term picture in there too, where longer term resistance now looks fatally damaged. Short term it has reached a potential resistance trendline though, and gold's failure to make a new high with silver is a possibly important bearish divergence. On the other important indicators today I've been watching EURUSD very carefully to see whether it has bottomed, and posted the falling wedge upper trendline yesterday as my bull/bear line in the sand. That line was an unconfirmed two hit trendline yesterday and the bounce was slightly higher at an alternate, now confirmed, trendline. While that trendline remains unbroken EURUSD is still in bear mode, and I've given the next downside targets on the chart:

AUDUSD had a similar moment of truth yesterday and reversed at resistance. That line remains the bull/bear dividing line and I'm expecting a significant drop unless it reverses to break that trendline:

I haven't charted the Yen much in recent months, but I was asked to look at this the other day and charted it on various timeframes. I was strongly struck by how well the 60min RSI signals important reversals, so I'll be looking at this a lot more often in future. I was also struck by the simply amazing long term short setup on Yen, which looks likely to drop a third in the next few years, and a lot of people have been talking about this and shorting the Yen. It's great to see such an opportunity on an instrument where the fundamentals really stink, but I haven't shorted it yet, and that's because the short term setup looks bullish rather than bearish, so I'm expecting a better entry soon. I'll cover the longer term setup another day but here's the short term USDJPY chart, which I would stress is an INVERTED Yen chart, so the bearish look of the chart is actually a short term bullish chart for Yen:

The last chart of the morning on 30yr Treasury futures, and I have to say that the bearish setup here is at odds with the bearish setup on equities. Treasuries have been in a counter-trend bounce for the last few days, but there's a nice looking bearish wedge on the chart that suggests strongly that they will soon resume the long march downwards. Obviously that could happen after an equities correction here:

Overall I'm still leaning short today, though NQ particularly might see a bounce to test strong resistance at 2400 again. Obviously it's opex Friday today and there could be some strange moves as a result. Big downward moves are fairly rare on opex Fridays and I'd be surprised to see one of those today.
