It sounds like good advice for any trader ("short EGO"), but in this case it refers to Eldorado Gold. This is a lovely triangle formation.
Slope of Hope Blog Posts
Slope initially began as a blog, so this is where most of the website’s content resides. Here we have tens of thousands of posts dating back over a decade. These are listed in reverse chronological order. Click on any category icon below to see posts tagged with that particular subject, or click on a word in the category cloud on the right side of the screen for more specific choices.
Kodiak Oil Looks Like a Long-Term Winner
(1) Terrific increase in volume lately;
(2) Two very clean breakouts;
(3) Ginormous inverted head and shoulders pattern with a target of $13-$14
As a side note, in spite of having tomatoes thrown at me every single time I mention it, GDX is just begging to be shorted. I said so yesterday, and it's down 1.88% as of this writing.
Buy Like Hell Zone? (by Springheel Jack)
It's always nice when a plan comes together. I posted two downside targets for ES on Tuesday morning. We hit the first on Tuesday and the second on Wednesday. We have now reached the highest probability reversal area IF this is going to reverse back up.
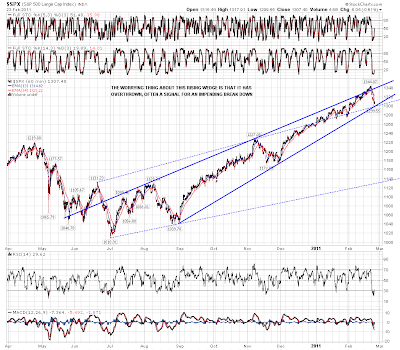
The arguments for a reversal back up here are strong. It's four months until the end of QE2, so a major top here seems unlikely. The technical setup also argues that a break below this level on SPX particularly would extend the downside move considerably. The overthrow on the main rising wedge on SPX since July has eliminated the possibility that the wedge would evolve into a rising channel, and the technical wedge target on a break below here would therefore be 1040, which seems overambitious to say the least.
The arguments against a major reversal back up here are also worth noting however. The shorter term rising wedge target on ES is 1262, and the target for the rather ugly HS pattern on ES is 1277. The move down so far is within tight declining channels on both ES and NQ, which suggests a single wave down, which implies that this may well not be the low. Too soon to say, but a break of the shorter term declining channels on ES and NQ would imply a strong bounce at least. Yesterday's weakness after the trend day on Tuesday is also a very weak sign, and was disturbing in terms of looking for a significant low here. I also posted my EEM chart the other day with a setup that mirrors the one that preceded the April top last year, and that's worth remembering too.
Here's the main rising wedge on SPX with a secondary support trendline also arguing for a bounce here at least:
Here's the picture on the ES 60min:

Here's the picture on the NQ 60min:

One thing that disturbed me about the low yesterday was that copper had reversed well short of the obvious 421 target. That was corrected overnight with a hit of 422.55, which is close enough. Worth noting however that the target is a possible HS pattern neckline, and that copper might therefore be reversing to build a right shoulder:

Oil reached my 98.8 target yesterday and blew through it overnight. I have a higher target at 115 on the basis of a rising channel sice the 2009 low with some resistance in the 111 area:
So will equities reverse for the start of a fresh wave up here? I have a lovely macro-scenario for the next few months if they do, and I'm really struggling with the idea that they might not four months before the end of QE2. I've heard all the arguments that this move up in the market is unrelated to quantitative easing, but when charting equity values next to periods of quantitative easing since 2009, there has been at the least a very remarkable correlation so far. We could see a major support break here, but that I'll have to see it to believe it I think, and I'm leaning strongly long here until yesterday's SPX lows are broken with confidence during trading hours.
The S&P, the Dollar, and Libya
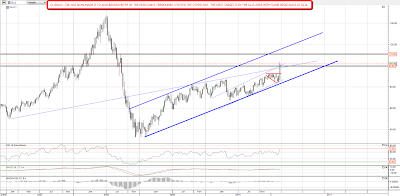
Its funny, post history everyone will want to blame a sell off in the markets on Libya. The reality is that the Mr. Market has a mind of his own that is very difficult to understand. Sometimes he wants to go up when there is only bad news and even while Egypt wants to rebel and put at risk the largest oil stores in the world and sometimes he wants to go down when a little country with a relatively small amount of Oil contributed to the world oil markets is also falling into revolution. The reality, is that the markets were going to go down regardless of Libya and seemed to want to go up regardless of the any reasonable analysis of Benny BURNake and the Ink Jets, the Banks, the manipulated data or the vast amount of unemployment. Below is an example of why…a 35 year trend line can do the trick especially when combined with a 75% retracement from the highs.
for a more detailled view of this chart click here
For a more detailled view of this chart click here.
…get your army boots on because its not long before they will be needed.
Also for more information regarding the dollar please read this post.
