Today is going well so far. I lightened way, way up on my shorts earlier today, and I've got two large long positions – GLD and GDX – which I intend to play for this bounce.
Slope of Hope Blog Posts
Slope initially began as a blog, so this is where most of the website’s content resides. Here we have tens of thousands of posts dating back over a decade. These are listed in reverse chronological order. Click on any category icon below to see posts tagged with that particular subject, or click on a word in the category cloud on the right side of the screen for more specific choices.
AAII Sentiment Survey (by MacroStory.com)
AAII Investor Sentiment for the week ending March 9, 2011 showed little change over the prior report. Those with a bullish outlook over the next six months fell to 36.0% versus 36.8% the prior week and below the historic level of 39.0%. Those with a bearish outlook fell to 32.3% versus 33.1% in the prior week and above the historic level of 30.0%. This report has correlated very well with the SPX and implies a move down in equities in the near term. The question now becomes though is this yet another correlation that has broken down?


Submitted by Macro Story. If you wish to read more, please visit - MacroStory.com
Drum Roll, Maestro…….
Dr Copper is Unwell (by Springheel Jack)
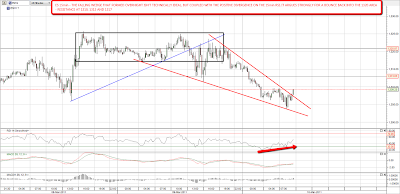
I've been watching for a break of the big H&S neckline on copper and we got that yesterday with confidence. The pattern target is 383 and copper is now in sell the bounces mode:
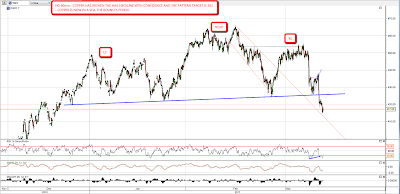
Is 383 the real target for this move though? I'd say most likely not, as a look at the bigger picture on the daily chart shows that this H&S neckline break is also a break of a broadening ascending wedge indicating to the 270 area, after a failure at two longer term resistance trendlines. The main rising support trendline from December 2008 is now in the 350 area and that is the main target in my view. If 350 is broken then the next target would be 270 and that may also be the neckline on a very large H&S. The target for that would be 75, and I'd be extremely doubtful about that playing out. Targets are therefore 383, then 350, then 270, with support at 350 likely to hold in my view:
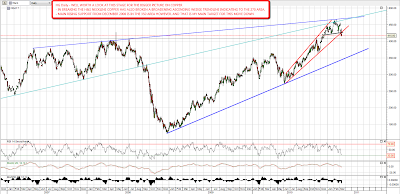
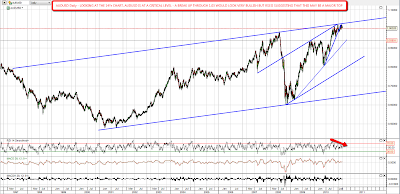
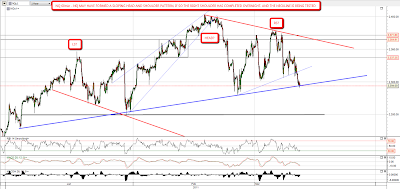
Is it possible that we've just seen a major top on copper? I've looked at AUDUSD to see whether there's any support for that on the AUD chart, and there is, as AUD is testing the upper trendline of a 14 year rising channel. A break through to 1.03 would look very bullish but the daily RSI isn't encouraging and there is a strong argument for a major top on AUDUSD here with targets in the 0.92, 0.8 and 0.68 areas depending on which support trendline holds:
So where does this leave equities? Well I'm definitely leaning strongly now towards a breakdown soon, but we won't necessarily see that today. ES made an interesting low overnight, as it bottomed at the original support trendline I had for the symmetrical triangle. I'm now inclined to see that low as the main hit at triangle support so the low at 1303.75 is now the line in the sand today for a break down from the triangle:
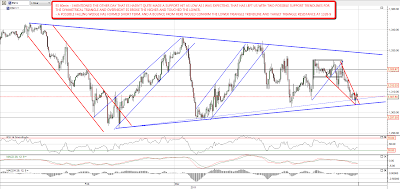
There is some reason to think that ES may bounce from support here, with the obvious target at triangle resistance in the 1328-9 area. A poorish quality falling wedge has formed since the highs yesterday and positive divergence on the 15min RSI is supporting a bounce. Resistance at 1310 has been tested twice since I capped this chart and a little IHS has formed. A break up through 1310 should open up 1320 as a target and if that is broken then I'd expect main triangle resistance at 1328/9 to be tested:
I've seen the forming sloping H&S on NQ posted several times in the last few days. I haven't been posting it myself because I don't much like it, as the neckline is a bit too mushy for my taste. Nonetheless it is a possible pattern and NQ has fallen to test the neckline overnight. If the neckline breaks with confidence I'd be looking for a move to 2250, where I have an alternative neckline for a larger H&S pattern. The sloping H&S target is 2160:
As I've been finishing up I see ES has broken up through 1310 so I'm expecting any gap down to be filled today and my targets on ES are 1317 for the little IHS, 1320 as the falling wedge target and 1328/9 for main triangle resistance. Most likely this is just a bounce before a break down however and I'm expecting the ES symmetrical triangle to break down soon with a pattern target 51 points below the break level. Triangle resistance may well not be tested before that break down.
Bullish on BAC (TraderHR)
Bank of America Corporation (BAC) jumped 66 cents (on Tues), or 4.70%, on one of the heaviest-volume sessions this year. Moreover, the stock closed above the downward sloping trend line of the symmetrical triangle pattern in which it has consolidated over the last two months.
The move confirms a trend reversal and the start of new momentum, which could move the stock towards the $15.70 area short-term. Preferred entry (buy stop) price is at $14.80 with a stop-loss price at $14.30.
Originally published on TraderHR.com.
