Slope initially began as a blog, so this is where most of the website’s content resides. Here we have tens of thousands of posts dating back over a decade. These are listed in reverse chronological order. Click on any category icon below to see posts tagged with that particular subject, or click on a word in the category cloud on the right side of the screen for more specific choices.
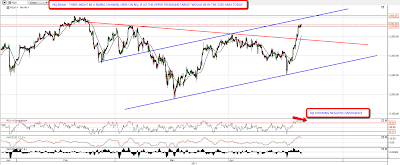
At the time of writing ESM1 has reached the February high to the tick at 1337.75 and is testing it. We may well see a new high today. After having a careful look at the continuation IHS that has formed I've redrawn the neckline sloping upwards slightly, so that's slightly higher at 1339.5. The 60min RSI is overbought and showing negative divergence so we may well see some retracement today or Monday and the obvious target for that retracement would be broken resistance at 1319. Pug's called this move very well and is expecting a wave peak in the 1340 – 1344 area, followed by a retracement into 1324 SPX, so that would fit my expectation very well:

NQ has led the rally from the Monday lows and has risen an amazing 130 points since then. I have a possible rising channel with resistance in the 2395 area, which is slightly below the February high which was at 2402.5:
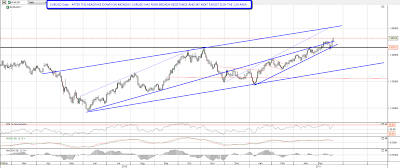
The dollar is crumbling badly as various currencies have broken up against it. That supports the bull case here which looks very powerful. EURUSD has now broken up through resistance with confidence and my next target is slightly over 1.50:
AUDUSD has also broken rising wedge resistance and my next target is in the 1.11 area. The target for the broadening formation that broke up in September last year has now been met, but there's no sign of a top for AUDUSD here:

Vix broke below the 15 support level that has held since mid-2007 and may drop quite a bit further if the break holds:

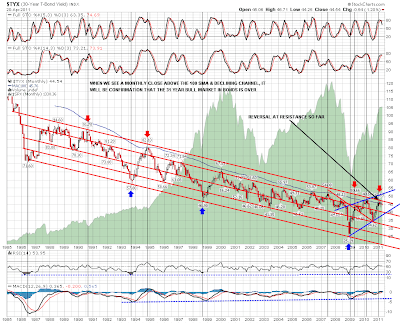
So all is well with the world. Equities and commodities are set to make strong new highs while the US dollar is being beaten to death with the Fed's printing press. There's something missing from the picture though, and that's a falling bond market and rising bond yields. Bond yields have been highly correlated with equities in this bull market and the consolation prize for bears from a big new wave up was always going to be a rise in bond yields that broke the 26 year declining channel on TYX. The top of that declining channel was tested in February, and bond yields then reversed with equities. So far though, the bond market is holding up and yields are still well below those February highs. I'm expecting that to change, and if it doesn't then a strong move up in equities here would diverge markedly from bonds. That channel resistance is solid however so we'll have to see how that goes:
There are a couple of odd things about this rally up from the Monday lows so far. Bonds are holding up as I said, and the Russell 2000, the Transports index and Financials look weak. The bull case looks strong however after this amazing move up since Monday and I'm expecting that we'll just be buying the dip as usual once new highs on ES and NQ are made and confirmed. A couple of things to mention are the Easter holiday trading stats from the Stock Trader's Almanac, which are well worth noting. The trading day before Good Friday has been up on Nasdaq 14 of the last 16 times, and ten straight times since 2001. The post-holiday Monday however has worse stats, down 16 of the 20 between 1984 and 2003, though it has been up 6 of the last 7 since then. Thanks to Cobra for those stats on the Monday after Good Friday.
The move down on Monday with the confirming equity bearish trendline breaks on EURUSD, copper and bonds was just a particularly impressive bear trap it seems. Many were fooled by it, including me, and there was a heartfelt post about it by a futures trader called Chris Johnston that echoed what many of us have been thinking this week. Definitely worth a read and thanks to my friend bullethead for posting the link for me.
This week is only three days old, but it feels like an eternity.
I came into the week 115% committed with a split of about 85/15 between bearish and bullish positions. Monday was a good day (obviously), and it seemed that things were starting to finally crack.
Ha!
The S&P downgrade can now be added to a long, long list of "this time for sure!" events that have been squished like a grape. The Dow is at a new recovery high, and all the after-hours activity is bullish again.
So while Monday was terrific, and Tuesday I gave up just a portion of those profits, Wednesday flat-out stunk. I was only 82% committed, but the portfolio was purely shorts, and I got stopped out left and right. I spent the day endeavoring to even out the portfolio with bullish positions to achieve more of a 50/50 split. The risk of the S&P bolting to 1430 is simply too great, and I don't get my jollies out of being smacked across the face with a ball peen hammer.
Suffice it to say that waking up to an /ES that was 17 points higher was just as unsettling as waking up to an /ES 17 points lower was exhilirating. As I sit here now, I am far more comfortable with a 50/50 portfolio of carefully-selected stocks. I don't have a single general equity ETF (like SPY, DIA, etc.) in either direction.
Of course, the downside of a totally balanced portfolio is that any moves are going to be completely muted. If we soar 150 points up (or down) tomorrow, the best I can hope for is a small profit (intraday ETF trades notwithstanding), since the only thing that prevents the positions from totally cancelling each other out is – – God willing – – that the selections are good enough so that the longs are a little stronger than average and the shorts are a little weaker than average.
But the market seems to be switching direction every couple of days, and I'm not comfortable being totally bullish or totally bearish right now. I am also very, very "light", with a big chunk of the portfolio in cash.
The point is that having such a portfolio coming into Monday (or Wednesday, for that matter) would have greatly reduced my portfolio's volatility. One would love to be totally long on up days and totally short on down days, but as long as you are fantasizing, you might as well imagine Gong Li giving you a vigorous massage with essential oils while you monitor your positions.
At present I've got 27 longs and 24 shorts. That's right – I have more longs than shorts. A few of the longs include CAVM, FNSR, GOOG, MA, MIPS, and VMED, and a few of the shorts include CQP, GS, HRB, NTAP, RADS, UAL, and XRTX.
One final word to those precious metals bulls out there who are setting the world on fire. I know exactly how it feels to be "printing" money just about every day. In the blessed months of late 2008 and early 2009, it seemed like I could do no wrong. Almost everything I did seemed to make money. That must be how you are feeling right about now.
Enjoy it while it lasts. Take those profits and have a treasure bath. But be really mindful of your mindset when it ends. And I know you don't believe me, but it will end someday, and years from now people will marvel at a chart like SLV and wonder what on earth people were thinking. I don't know when the party in precious metals will end, but it's easy to lose sight that markets don't usually throw giant sacks of cash at people like this. You have my fondest hopes of maximizing your profits and making an elegant exit. But take it from someone who knows how it feels to do everything right – – and who also knows how it feels when it seems he does everything wrong – – it ain't gonna last forever, as much as you hope it might.
I did a quick analysis of my SPY Gap Data … specifically I looked at large up gaps (> $1.00) that did not fill. I just looked at 2010 and 2011. There were 18 such gaps in 2010 and 3 in 2011 (not including today).
There was actually 2 Gaps in 2010 (during the summer correction period) that filled. If you look at the stats of the 20 opening gaps in 2010 that opened $1.00 or more above the previous close, 15 closed above the opening price level … in other words, the odds of making money on a SPY purchase at the open was about 75%. In 2011, we have had 4 total gaps higher of this size and 3 have closed above the opening price for a winning percentage of 75% as well.
Of interest in the data chart above is that today's price range for the SPY was the smallest by far compared to the rest of the 2010 and 2011 data. Question is whether or not all of the shorts are already scared out of their positions or if there is another reason for the lackluster performance today.
Of interest is the performance data when looking out 1, 3 or 5 days after the large Gap Day … the next day was red (negative) about 60% of the time compared to about 46% of the time when looking at any random period.
When looking out 5 trading days, the SPY was positive 62% of the time versus 53% of the time when looking at any random period (random % data is per Sentiment Trader).
Anyways, take it for what it's worth …. don't be surprised or disappointed if we have a down day tomorrow.
Cheers … Leaf_West Visit my blog
Originally published on TheTechTrader.com.
