Slope of Hope Blog Posts
Slope initially began as a blog, so this is where most of the website’s content resides. Here we have tens of thousands of posts dating back over a decade. These are listed in reverse chronological order. Click on any category icon below to see posts tagged with that particular subject, or click on a word in the category cloud on the right side of the screen for more specific choices.
Corinthian Colleges Lottery Long
Ambiguous Setup (by Springheel Jack)
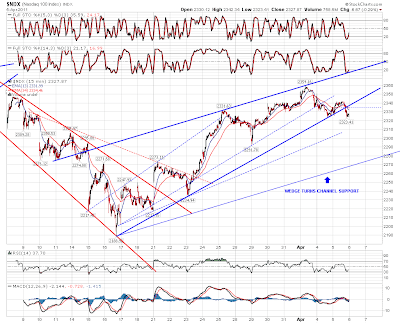
I have very mixed feelings about market direction this morning. On the bear side, both SPX and NDX broke support on the rising wedges that I posted yesterday. Here's the SPX 15 min chart:

Here's the NDX 15min chart:
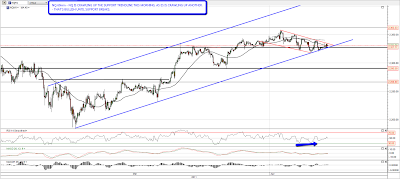
The futures charts are less bearish, with both ES and NQ crawling up big support trendlines overnight. Here's the NQ 60min chart showing the position there, and effectively NQ has formed a little triangle at support. There's little room to move left without breaking up or down and I'll be seeing a break of 2335 as bullish, and a break of 2325 as bearish for today:
Copper adds to the mixed picture here today, as it has most definitely broken up from a little IHS and larger rectangle overnight. The targets are marked on the chart and I'm expecting more upside, though there is some scope for a retest of the broken IHS neckline and rising channel support in the 428.5 area:

Silver reached the resistance trendline I posted yesterday and resistance is holding so far. We could see some retracement here with internal support in the 37.3 area:
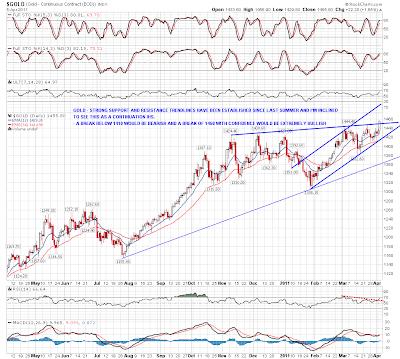
I'm doubtful about seeing that resistance trendline on silver hold though, as gold made a very major resistance break yesterday. If sustained this may well signal the start of a big move up:
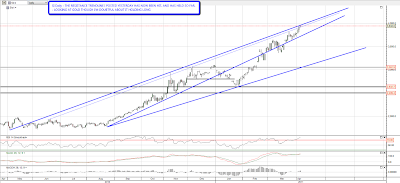
zstock7 suggested a long on Google if it reaches 560 to me yesterday. ztock7's timescale is probably shorter than the one I looked at on the GOOG weekly chart, but the bullish setup there is well worth a look, There's definitely scope there to chop around between 555 and 630 for a while longer, but as a longer term buy GOOG looks very attractive here:

I'm leaning short on balance today on equities, but not with much conviction. If the opening gaps are closed I'd expect them to continue downwards. If ES and NQ can hold the overnight gains however then the bias has to be up.
I've been meaning to do a dedicated post looking at EURUSD but haven't had time in the last few days. Looking at EURUSD this morning though, I see that can't wait any longer, so I'll write that next and should have that posted before the open today
The Past Three Years of the Silver Bears
Peeling the EUR USD Onion (by Springheel Jack)
I've been meaning to do a dedicated post on EURUSD for a few days but have been struggling to find the time. Given that EURUSD has now reached a critical test in the 1.428 – 1.43 area overnight however, it will wait no longer, so I'm doing this as a second post before the open today. All charts were prepared last weekend but the technical situation hasn't changed much other than the small move up into the key test that I've been expecting.
In the short term, EURUSD is within a rising wedge. That's bearish though it would be much more bearish if the upper trendline for a break up to evolve into a rising channel hadn't already been established. There's a similar rising wedge on AUDUSD with resistance now in the 1.05 area. As with EURUSD, AUDUSD is still well short of testing the upper wedge trendline:
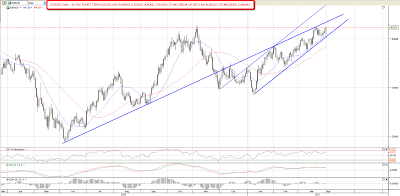
The context for the current rising wedge is within a greater rising channel from the summer lows last year:

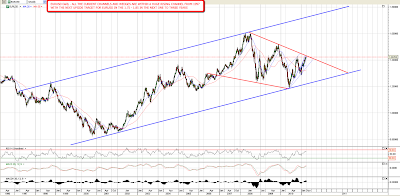
The reason the 1.428 – 1.43 level is interesting however is because of declining resistance from the all time high on the 5 year chart. That trendline is the resistance trendline on a (bullish) falling wedge indicating to the 1.60 area on a break up. If wedge resistance holds on the current move up then there is a technical target in the 1.10 for a move down on EURUSD here, though for reasons that become obvious on the next chart, it seems unlikely that EURUSD could make that downside target:

To get the true big picture on EURUSD though, we have to look back into the 1990s, where the support trendline on EURUSD that first hit in 2002 is matched by an upper channel trendline dating back to 1997. The sharper eyed observers among you will note that the Euro was only launched in 1999, but the currency mix within the Euro was already long established, and the chart therefore goes back before the launch.
The current area is key because of the five year falling wedge and declining resistance from the 2008 high, and a break above will look extremely bullish to my eye. If EURUSD breaks above the falling wedge then the shorter term rising wedge is the pattern to watch for long entries, but the overall picture will be looking towards first a test of the all time high just over 1.60, then a break above to channel resistance in the 1.75 to 1.85 area over a likely timescale of the next one to three years.
As I'm writing EURUSD is trading slightly over 1.43, but I'm waiting to see a break of 1.43 with confidence and the daily close. If we see that break then rising wedge resistance should be hit next in the 1.4375 – 1.439 area, and that could well be an important short term high, though I'd then be inclined to buy any dips on EURUSD on the longer term picture.
Will EURUSD reverse here? It may well. EURUSD made the last major high in November 2009, four months before the end of QE1, so the timing looks promising. We could well see an important high here followed by a several month retracement into the announcement of QE3, just as we saw last year. The DX chart is looking promising for a reversal, though a conviction break below support would negate the current bullish setup:

I'll be watching for that retracement, but it's hard to be optimistic about the US dollar's longer term prospects here. Dollar bulls are fighting the Fed in just the same way that equity bears are fighting the Fed. The Fed's strategy is to flood the world with newly printed dollars to create strong asset inflation. It's hard to argue with the results of that strategy so far, and the laws of supply and demand argue for a big fall in the value of the US dollar in response. That large rising channel shows the likely shape of that decline in my view, and if EURUSD reverses here I'll be watching carefully to identify the next big low, which should be a good multi-year long play.
