
BAC Again
In a post last week ("Optimal Hedging Costs: A Tell for Stocks"), we mentioned that Bank of America (BAC) had the highest hedging costs in the Dow for most of the last several months, and we speculated about how those high hedging costs might have been a red flag for BAC longs. BAC is up about 28% since then, on news of Warren Buffett's $5 billion preferred stock investment in the Berkshire holding. But as David Weidner noted on Tuesday, Buffett followers who piled into the common stock of Goldman Sachs and General Electric after previous preferred stock investments by Buffett are still under water.
As if to underscore that risk, take a look at which name in the table below had the highest hedging costs as of Tuesday.
Hedging update
The table below shows the costs, as of Tuesday's close, of hedging BAC along with a basket of other stocks and ETFs against greater-than-20% declines over the next several months, using optimal puts. First, a reminder about what optimal puts mean in this context, then a step by step example of finding optimal puts for one of the ETFs listed below (QQQ).
Optimal Puts
Optimal puts are the ones that will give you the level of protection you want at the lowest possible cost. As University of Maine finance professor Dr. Robert Strong, CFA, has noted, picking the most economical puts can be a complicated task. With Portfolio Armor (available on the web and as an Apple iOS app), you just enter the symbol of the stock or ETF you're looking to hedge, the number of shares you own, and the maximum decline you're willing to risk (your threshold). Then the app uses an algorithm developed by a finance Ph.D to sort through and analyze all of the available puts for your position, scanning for the optimal ones.
A Step by Step Example
Here is a step by step example of finding the optimal puts for one of the ETFs listed below, QQQ.
Step 1: Enter a ticker symbol
In this case, we're using QQQ, so we've entered it in the "Ticker Symbol" field below: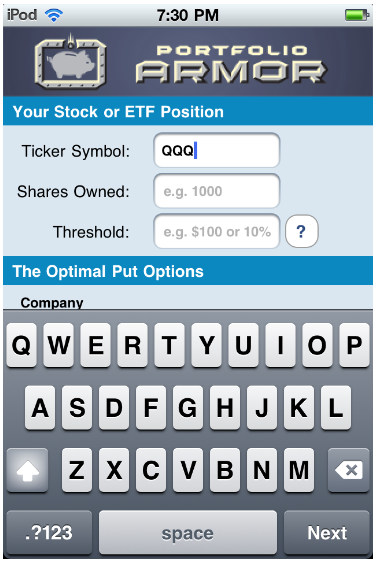
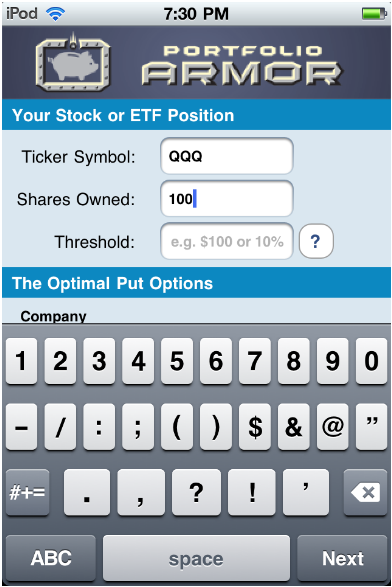
Step 2: Enter a number of shares
For simplicity's sake, we've entered 100 in the "shares owned" field below, but you could also enter an odd number, e.g., 631. In that case, Portfolio Armor would round down the number of shares of QQQ you entered to the nearest hundred (since one put option contract represents the right to sell one hundred shares of the underlying security), and then present you with 6 of the put option contracts that would slightly over-hedge the 600 shares of QQQ they cover, so that the total value of the 631 shares of QQQ would be protected against a greater-than-20% decline.
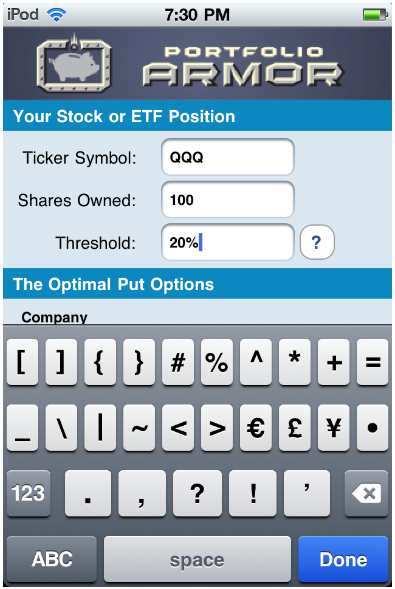
Step 3: Enter a decline threshold
You can enter any percentage you like for a threshold when using Portfolio Armor (the higher the percentage though, the greater the chance you will find optimal puts for your position). The idea for a 20% threshold comes, as I've mentioned before, from a comment fund manager John Hussman made in a market commentary in October 2008:
An intolerable loss, in my view, is one that requires a heroic recovery simply to break even … a short-term loss of 20%, particularly after the market has become severely depressed, should not be at all intolerable to long-term investors because such losses are generally reversed in the first few months of an advance (or even a powerful bear market rally).
Essentially, 20% is a large enough threshold that it reduces the cost of hedging but not so large that it precludes a recovery. So we've entered 20% in the Threshold field in the screen cap below.
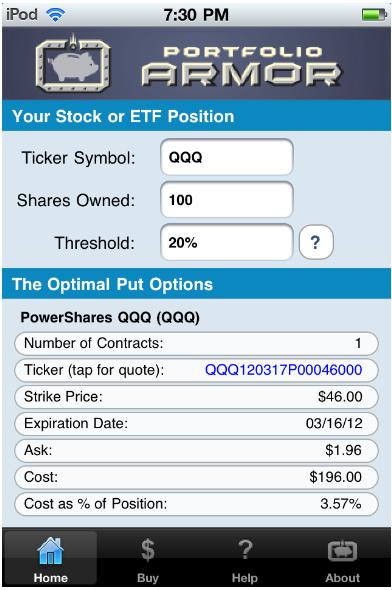
Step 4: Tap the "Done" button
A moment after tapping the blue button, you'd see the screen cap below, which shows the optimal put option contracts to buy to hedge 100 shares of QQQ against a >20% drop between now and March 16, 2012. Two notes about these optimal put options and their cost:
- To be conservative, Portfolio Armor calculated the cost based on the ask price of the optimal puts. In practice an investor can often purchase puts for a lower price, i.e., some price between the bid and the ask.
- As volatility has climbed, so have hedging costs. The VIX S&P 500 volatility index closed at 32.89 on Tuesday. On May 25th, when the VIX was at 17.07, the cost of hedging QQQ against a >20% decline over the same length of time was only 1.64%, as we noted in this article published the following day. As the screen shot below shows, as of Tuesday, the cost as a percentage of position was 3.95%.
Hedging costs as of Tuesday's close
|
Symbol |
Name |
Cost of Protection (as % of Position value) |
|
Widely-Traded Stocks |
||
|
INTC |
Intel |
3.46%* |
|
CSCO |
Cisco Systems |
4.73%* |
|
MSFT |
Microsoft |
2.90%* |
|
ORCL |
Oracle |
5.63%*** |
|
BAC |
Bank of America |
16.8%** |
|
F |
Ford |
9.57%*** |
|
GE |
GE |
6.08%*** |
|
PFE |
Pfizer |
3.92%*** |
|
WFC |
Wells Fargo |
6.73%* |
|
T |
AT&T |
2.16%* |
|
AA |
Alcoa |
6.55% * |
|
Major Index ETFs |
||
|
QQQ |
PowerShares QQQ Trust |
3.57%*** |
|
SPY |
SPDR S&P 500 |
3.61%*** |
|
DIA |
SPDR Dow Jones Industrial Average |
3.25%*** |
|
Precious Metals ETFs |
||
|
GLD |
SPDR Gold Trust |
1.51%*** |
|
SLV |
iShares Silver Trust |
5.45%* |
|
DBP |
PowerShares DB Precious Metals |
1.34%* |
|
SGOL |
ETFS Physical Swiss Gold Shares |
1.92%*** |
|
SIVR |
ETFS Physical Silver Shares |
8.73%*** |
*Based on optimal puts expiring in January, 2012
**Based on optimal puts expiring in February, 2012
***Based on optimal puts expiring in March, 2012
