
This article by The Wall Street Journal today reported that the National Association of Realtors revised downward its sales figures by 14% from 2007 through 2010, showing that the housing bust was far worse than initially thought: http://blogs.wsj.com/economics/2011/12/21/realtors-lower-2007-2010-home-sales-estimates-by-14/
It makes me wonder if Realty and Home Builders stocks and ETFs are overvalued by 14% by implication…
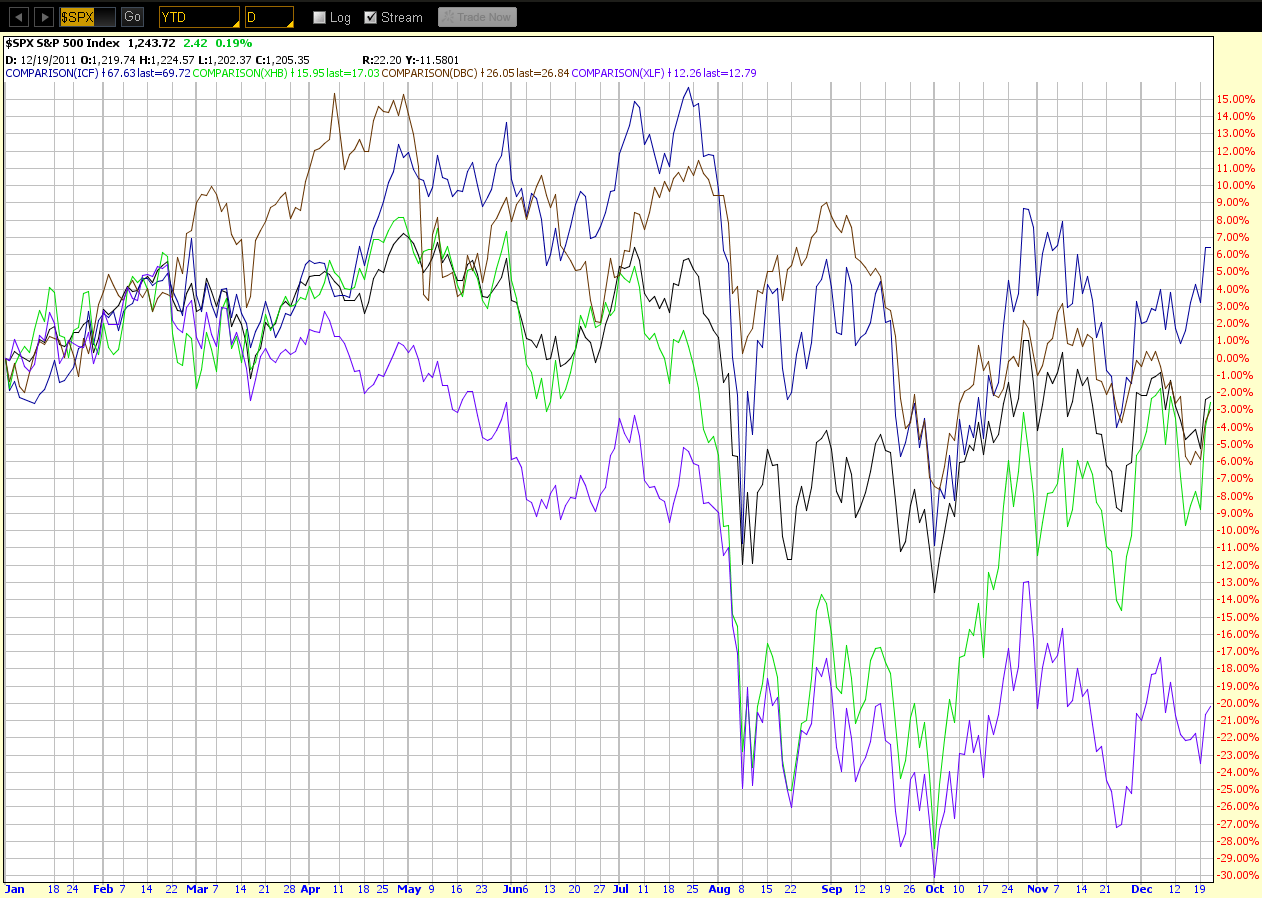
Below is a Year-to-date percentage comparison chart of the S&P 500 Index with the Realty Majors ETF, ICF, the Home Builders ETF, XHB, the Commodities ETF, DBC, and the Financials ETF, XLF. I mentioned some of these in my post yesterday: http://strawberryblondesmarketsummary.blogspot.com/2011/12/markets-sample-christmas-pudding-early.html
On this particular chart, we can see that Commodities have basically outperformed the S&P 500 from January, but are now very slightly below…the Realty sector has played "market leapfrog" with Commodities and has been in the lead since October 20th…the Home Builders sector has lagged the S&P 500 since July 1st, but has just shot above very slightly…and the Financials sector has lagged all of these instruments since February 22nd.
Something I'll watch for is whether the Realty sector and Commodities sector continue to outpace the S&P 500 and, potentially, move it higher, and whether the Home Builders sector is seriously improving or whether this week's rally was just speculative. Additionally, I'll track the Financials sector to see whether it continues to firm and build support, or whether major weakness sets in. Any ensuing major decline by any of these ETFs could negatively impact the S&P 500.
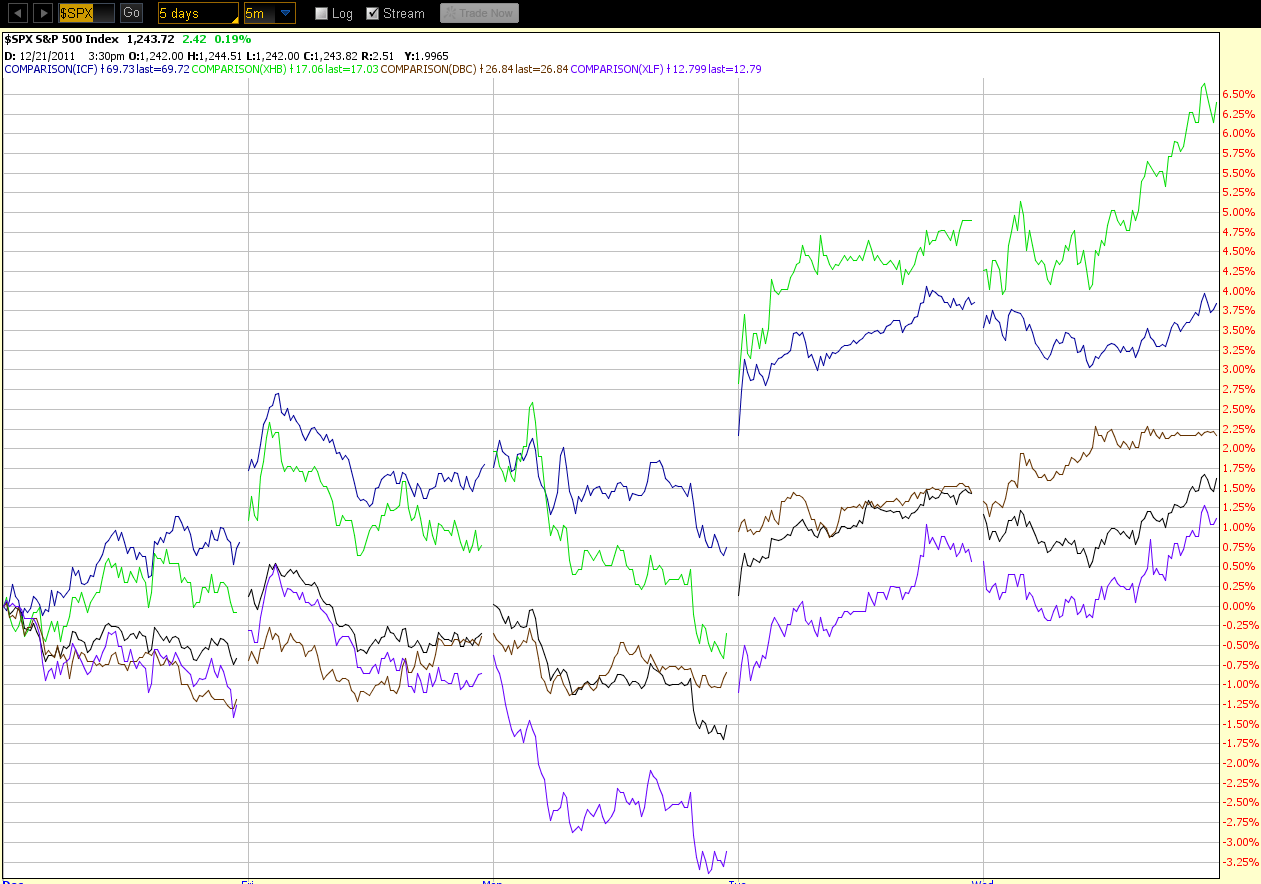
The 5-Day 5-minute percentage comparison chart below of these instruments depicts the jump higher by XHB over the past 2 days…we'll see whether that continues for the rest of this week and following weeks.

http://strawberryblondesmarketsummary.blogspot.com/
