
Here's how Week 1 closed on January 27th for YM, ES, NQ & TF. This was the week of the FOMC announcement to keep interest rates low until the end of 2014. As I mentioned in my post of January 25th, these four e-min futures indices have been travelling upward in a channel from their 2011 lows.
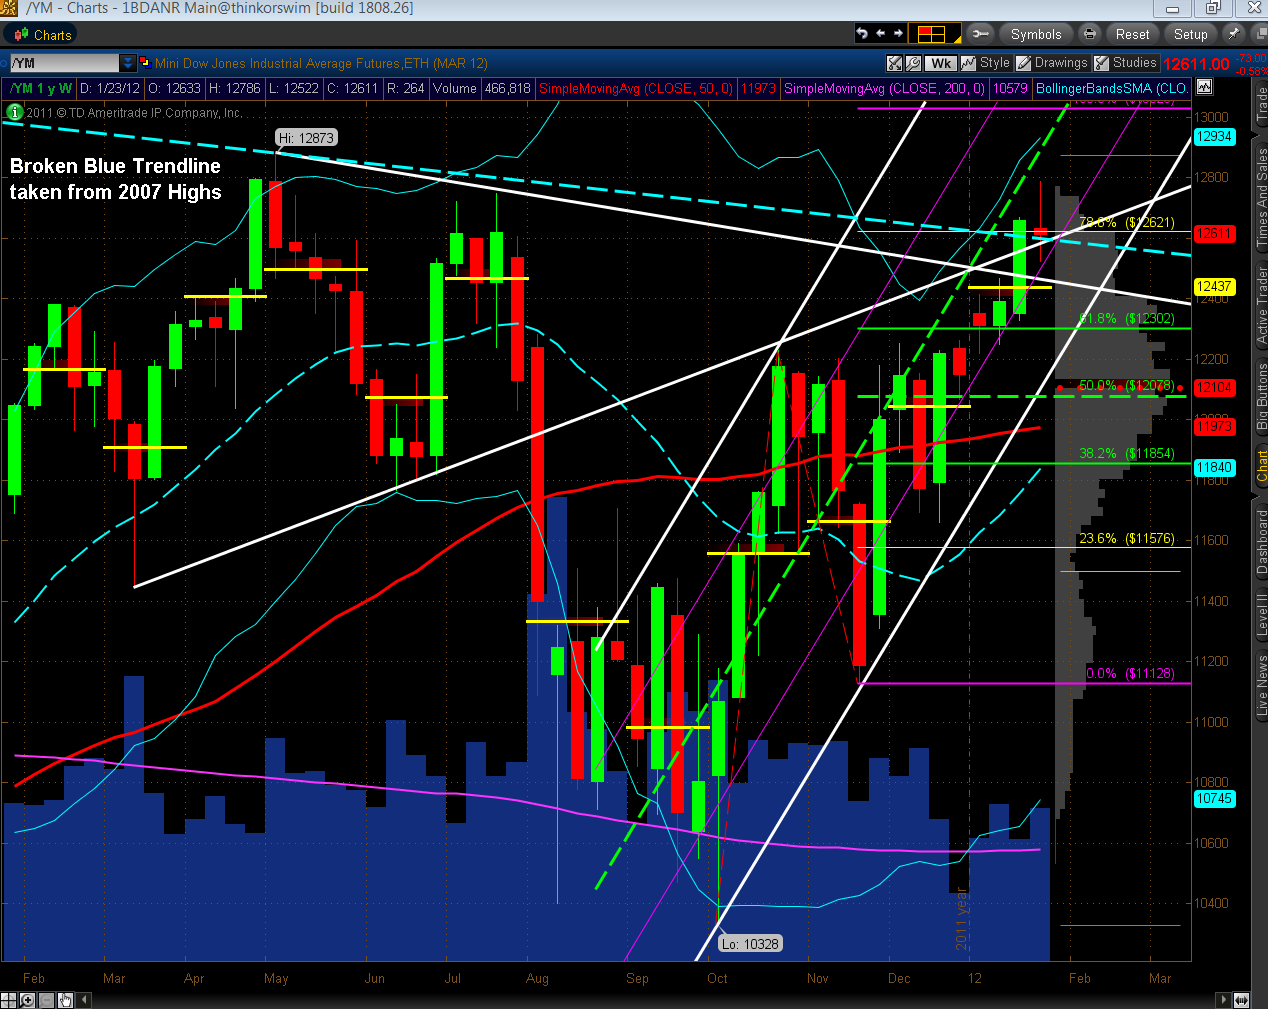
The first Weekly chart below shows that YM took a slight loss from the prior week after attempting new highs, but closed just above a confluence of 3 trendlines (one from the highs of 2007), a 78.6% Fibonacci extension level, this month's Volume Profile POC (horizontal yellow line), and the lower one-quarter of the channel on higher volumes than the prior week. Current price sits well above its 50 sma (red). The weekly uptrend hasn't been broken yet for YM.
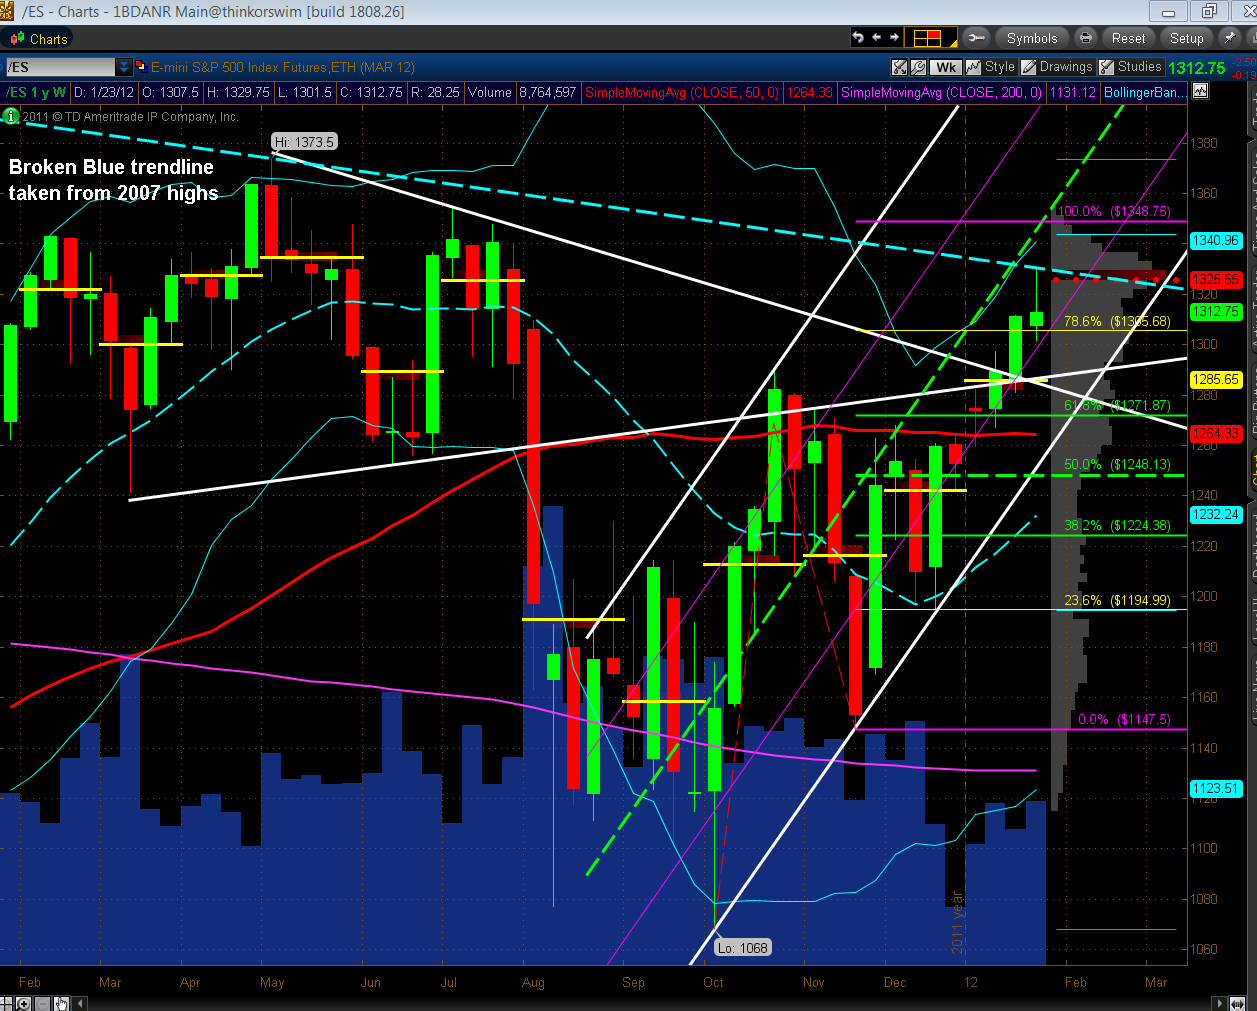
The second Weekly chart below shows that ES made a very slight gain from the prior week after attempting to break above the downtrend line from the 2007 highs, but closed just above a confluence of 2 trendlines, a 78.6% Fibonacci extension level, this month's Volume Profile POC, and the lower one-quarter of the channel on higher volumes than the prior week. Current price sits well above its 50 sma. The weekly uptrend hasn't been broken yet for ES.
The third Weekly chart below shows that NQ gained on the week and retreated slightly, after touching its upper Bollinger Band and upper one-quarter of the channel, and after nearly hitting its 78.6% Fibonacci extension level. It closed well above its channel "mean" (broken green line), well above this month's Volume Profile POC, and above last year's high of 2435.50 on higher volumes than the prior week. Current price sits well above its 50 sma. The weekly uptrend hasn't been broken yet for NQ.

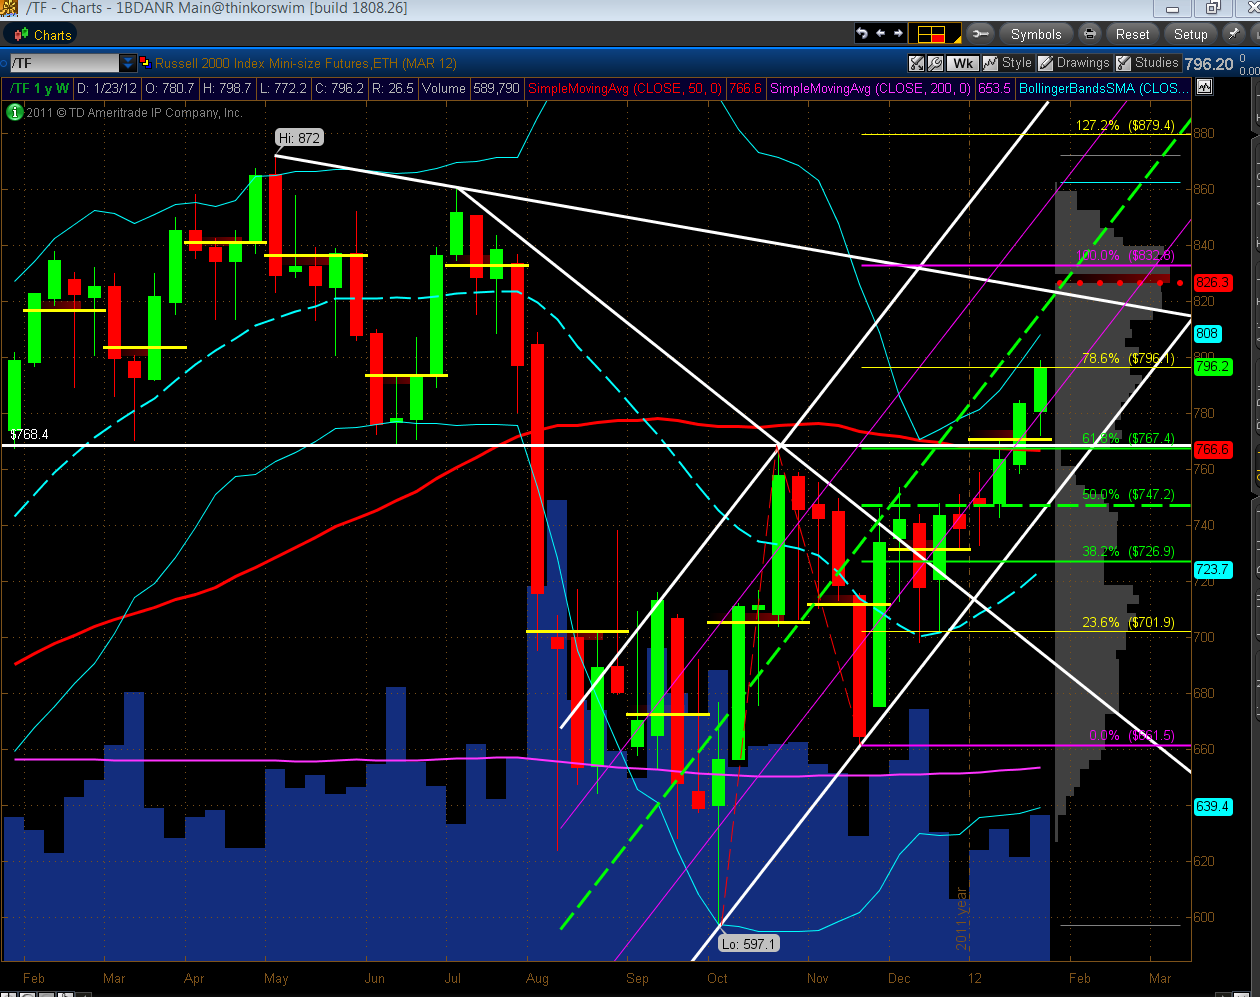
The last Weekly chart below shows that TF gained on the week and closed near its high and very slightly above its 78.6% Fibonacci extension level on higher volumes than the prior week. Current price sits in between the channel "mean" and lower one-quarter of the channel and above this month's Volume Profile POC and 50 sma. The weekly uptrend hasn't been broken yet for TF.
In conclusion, it appears that the bulls need to focus on boosting ES higher, while keeping YM propped up, as well as to keep buying Copper, as mentioned in last night's post, if they are going to keep this upward momentum in play on these indices, as well as break and hold above the major downtrend line from the 2007 highs. This re-enforces what I said in that post.
http://strawberryblondesmarketsummary.blogspot.com/
