
Big Cap Tech Versus Internet Bubble 2.0
Hey fellow Slopers,
Mike Paulenoff's post Wednesday afternoon ("Big-Cap Tech Stocks to Watch") and the release of Groupon's earnings later in the day, prompted me to take another look the hedging costs of some big cap tech stocks along with the cost hedging Groupon and a few other Internet companies that went public in 2011.
Groupon dropped 15.6% after hours Wednesday after it announced a Q4 loss, but at least one observer was bullish on it on Twitter. You might recognize his name from the late '90s:
Groupon now generating operating profit and strong free cash flow read.bi/ypRGEU Meanwhile, idiots still saying "Can't make money"
— Henry Blodget (@hblodget) February 8, 2012
Even Blodget admits that Groupon is overvalued though — he's bullish on the company, but not the stock now. Options investors seemed to be bearish on the stock as well, judging by the high cost of hedging it on Wednesday. Of the new tech companies here, Groupon was one of the most expensive to hedge. The table below shows the costs, as of Tuesday's close, of hedging Groupon and seven other tech stocks — big caps and ones with 2011 IPOs — against greater-than-33% declines over the next several months, using optimal puts.
A comparison
For comparison purposes, I've also added the cost of hedging the PowerShares QQQ Trust ETF (QQQ) against the same decline. First, a reminder about what optimal puts are, and a note about why I've used 33% as a decline threshold this here; then, a screen capture showing the optimal puts to hedge the comparison ETF QQQ.
About Optimal Puts
Optimal puts are the ones that will give you the level of protection you want at the lowest possible cost. Portfolio Armor (available on the web and as an Apple iOS app), uses an algorithm developed by a finance Ph.D to sort through and analyze all of the available puts for your stocks and ETFs, scanning for the optimal ones..
Decline Thresholds
In this context, "threshold" is the maximum decline you are willing to risk. You can enter any percentage you like for a decline threshold when scanning for optimal puts (the higher the percentage though, the greater the chance you will find optimal puts for your position). In the past, when looking at the hedging costs of Internet stocks I've used 25% decline thresholds, but a couple of these names, Groupon Inc. (GRPN) and Zynga, Inc. (ZNGA), were too expensive to hedge using 25% thresholds (i.e., the cost of hedging each of them against a greater-than-25% decline was itself greater than 25%, so Portfolio Armor indicated no optimal contracts were found for them). The lowest decline threshold it was possible to hedge ZNGA against was 33%, so that's the threshold I've used for it and all the other names below.
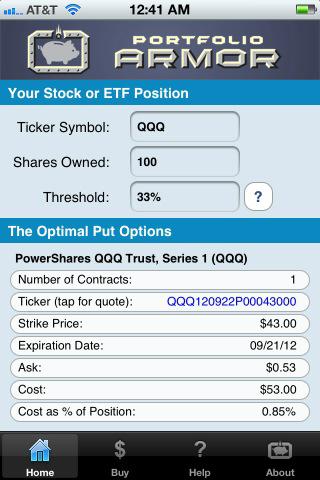
The optimal puts for QQQ
Below is a screen capture showing the optimal put option contract to buy to hedge 100 shares of QQQ against a greater-than-33% drop between now and September 21st. A note about these optimal put options and their cost: to be conservative, Portfolio Armor calculated the cost based on the ask price of the optimal puts. In practice an investor can often purchase puts for a lower price, i.e., some price between the bid and the ask (the same is true of the rest of the names below).
Hedging costs as of Wednesday's close
The table below shows the costs, as of Wednesday's close, of hedging these names against greater-than-33% declines over the next several months. Costs are presented as percentages of positions value.
|
Symbol |
Name |
Hedging Cost |
| 2011 Tech IPOs | ||
| GRPN | Groupon, Inc. | 22.4%* |
| LNKD | 6.27%** | |
| P | Pandora Media, Inc. | 15.5%*** |
| ZNGA | Zynga Inc. | 27.8%*** |
| Big Cap Tech Stocks | ||
| GOOG | Google, Inc. | 0.66%*** |
| MSFT | Microsoft Corporation | 0.46%* |
| INTC | Intel Corporation | 0.71%* |
| CSCO | Cisco Systems, Inc. | 0.78%* |
| AAPL | Apple Inc. | 0.36%* |
| Comparison ETF | ||
| QQQ | PowerShares QQQ Trust | 0.85%*** |
*Based on optimal puts expiring in July
**Based on optimal puts expiring in August
***Based on optimal puts expiring in September
