
Further to my last weekly market update, here is a summary of where money flow ended for Week 1 of March, 2012.
The Weekly charts below of YM, ES, NQ & TF show that the YM, ES and NQ made a higher close than the prior week on higher volumes. The ES did not close above its 2011 high of 1373.50, but made a higher closing high. The NQ broke out of and closed above its upper channel. The TF made a lower weekly close for a second consecutive week on higher volumes…it's also the only one not to have made a higher weekly close in February since Week 1…one to watch for possible continuing weakness, particularly if it breaks and holds below its uptrending lower channel and Fibonacci extension confluence level around 796.00.
On this timeframe, I'd put near-term support levels at 12875 for YM, 1352 for ES, 2569 for NQ (these levels being February's Volume Profile POC), and 796.00 for TF (as mentioned above).

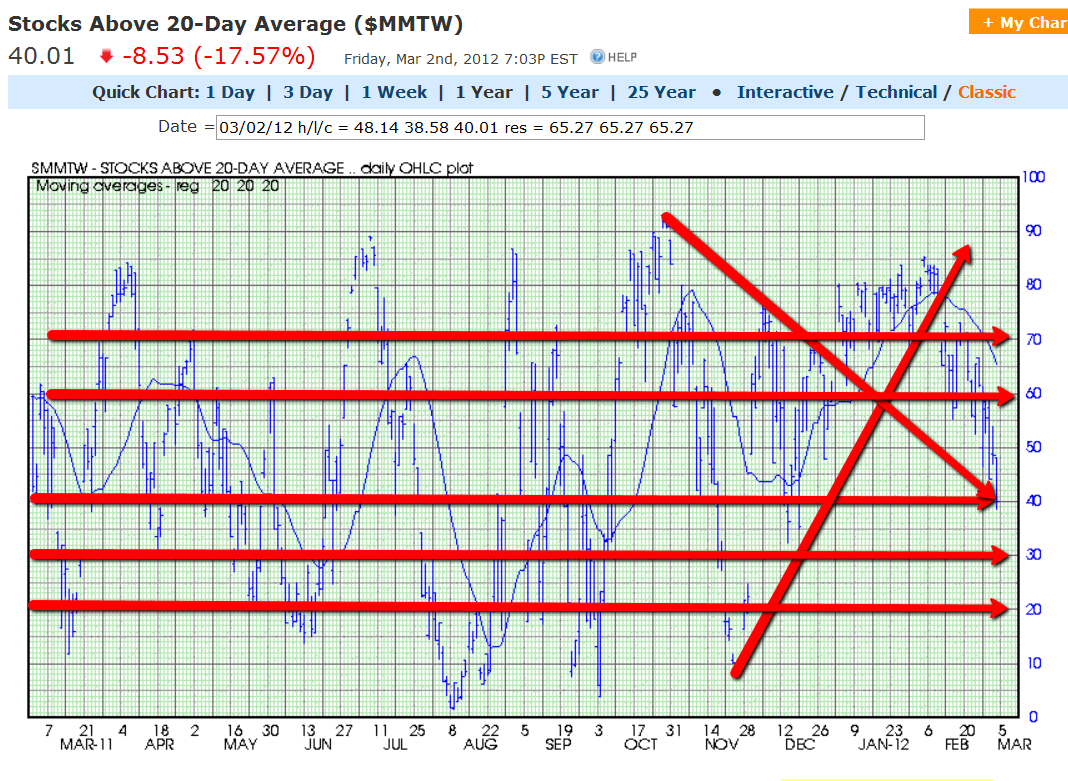
The three Daily charts below depict support and resistance levels on Stocks Above 20-Day, 50-Day, and 200-Day Averages.
Stocks Above 20-Day Average have broken below their prior support level and sit at the next support level of 40%.
Stocks Above 50-Day Average have also broken below their prior support level and sit just above their next support level of 60%.

Stocks Above 200-Day Average have yet to break below their current support level of 65%.

From these, I'd conclude that, in the short term, stocks have turned mildly bearish, in the medium term, stocks remain mildly bullish, and in the longer term, stocks remain bullish. Further short-term downside movement in the Major Indices would cause all of these to break below their current support levels.
The VIX fell by 4.95% this past week, as shown on the graph below.

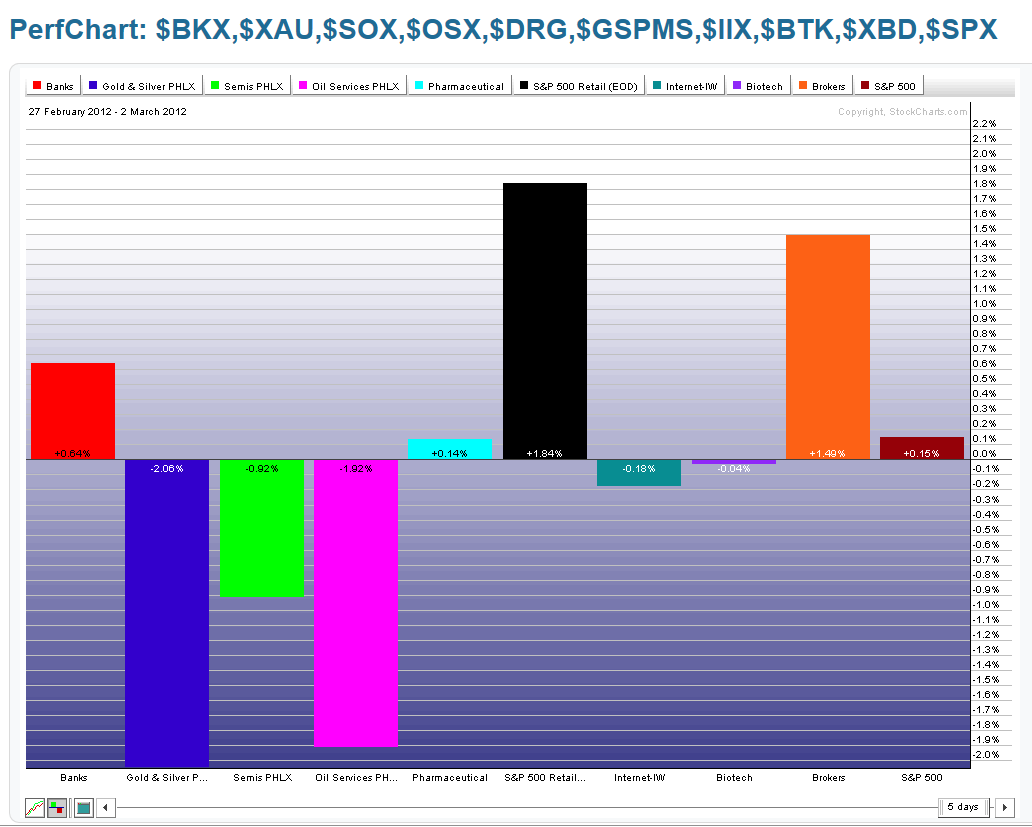
In contrast to the percentage lost by the VIX, the S&P 500 only gained 0.15%, as shown on the graph below. Of the Industry Groups, Retail was the biggest gainer, followed by the Brokers and Banks. Gold/Silver and Oil were the biggest losers, followed by Semi-Conductors. Interesting that the S&P 500 did not confirm the gain by Retail, Banks, and Brokers…a Major Index to keep an eye on for possible developing weakness.
As reflected above, the Energy Sector was the biggest loser, followed by the Industrials, Materials, and Utilities, as shown on the graph below. Consumer Discretionary, Technology, Financials, Consumer Staples, and Healthcare gained on the week.

The Emerging Markets ETF was the biggest gainer, followed by the European Financials and Chinese Financials ETFs, as shown on the graph below. The U.S. Financials ETF gained about one-third (in percentage) of what its European and Chinese counterparts gained…ones to watch in upcoming weeks. The Agricultural ETF gained nearly two-thirds of 1%.

Copper was the only metal to gain on the week, whereas Gold and Silver lost, along with Oil, as shown on the graph below. If Gold, Silver and Oil reverse course over the next week(s), it will be interesting to see if Copper continues making gains, particularly if the S&P 500 weakens.

As shown on the graph below, minor gains were made in the Major Indices, except for the Russell 2000, which lost nearly 3% (one to watch over the next weeks), and the Dow Transports (another one to watch as it closed below its 50 sma on the Daily timeframe) which had minor losses (this is the fourth week of losses for this index). The Nasdaq 100 made a 1.34% gain on the week. There was a 0.59% loss in the High Dividend-Paying Stocks ETF, minor buying in the Corporate Bonds ETF, and a 2% gain for the Emerging Markets ETF.

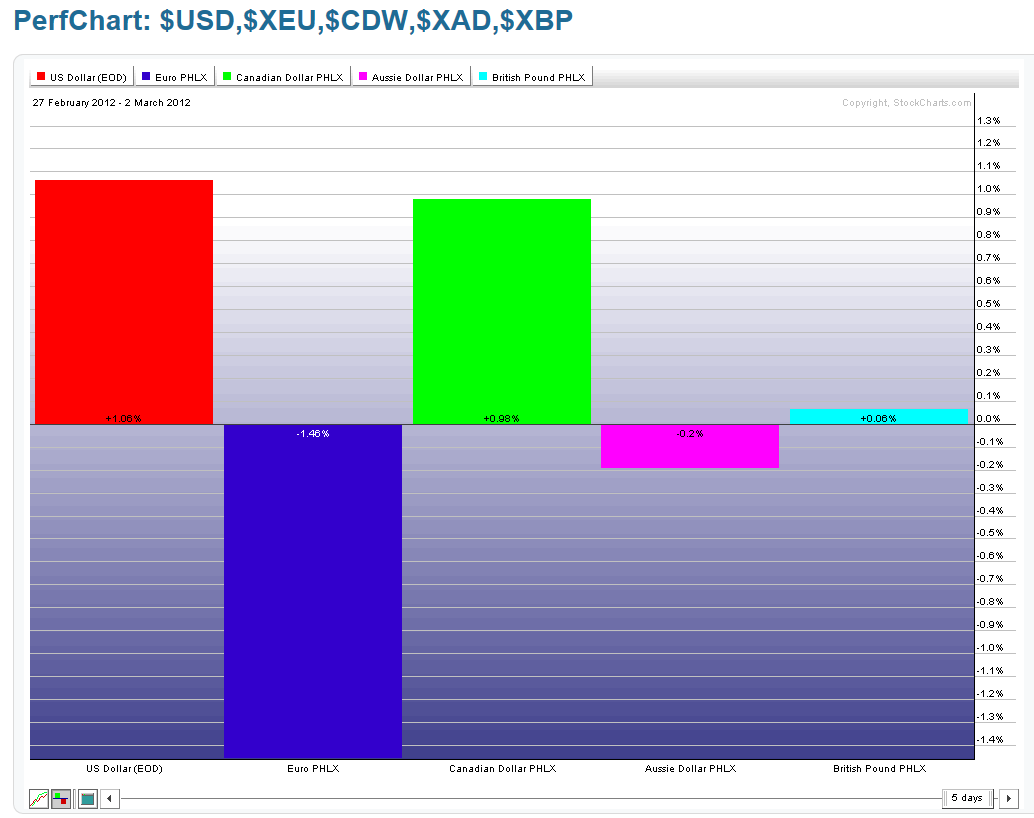
As shown on the graph below, the U.S. $ gained the most, followed by the Canadian $, and the British Pound. The Euro lost the most (in contrast with the gain in the European Financials ETF), followed by the Aussie $. We'll see if the U.S. $ continues to gain in the coming week(s), especially if the S&P 500 weakens. If the Euro continues to decline, this may have a drag on the European Financials ETF.
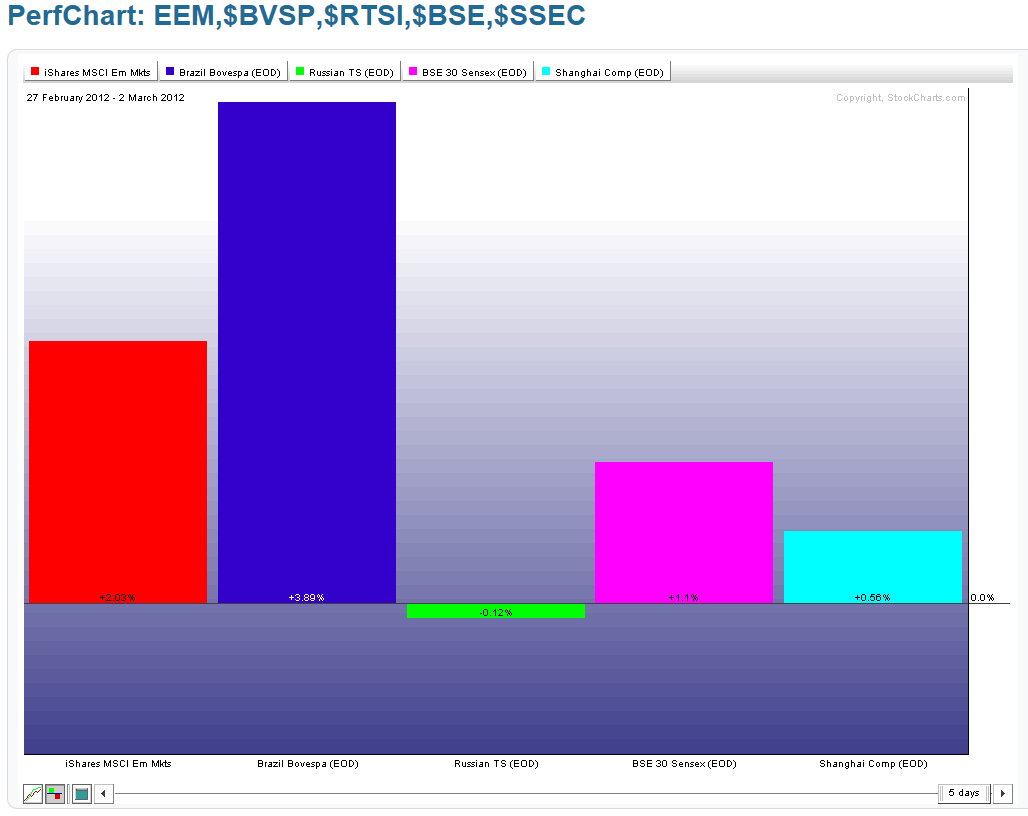
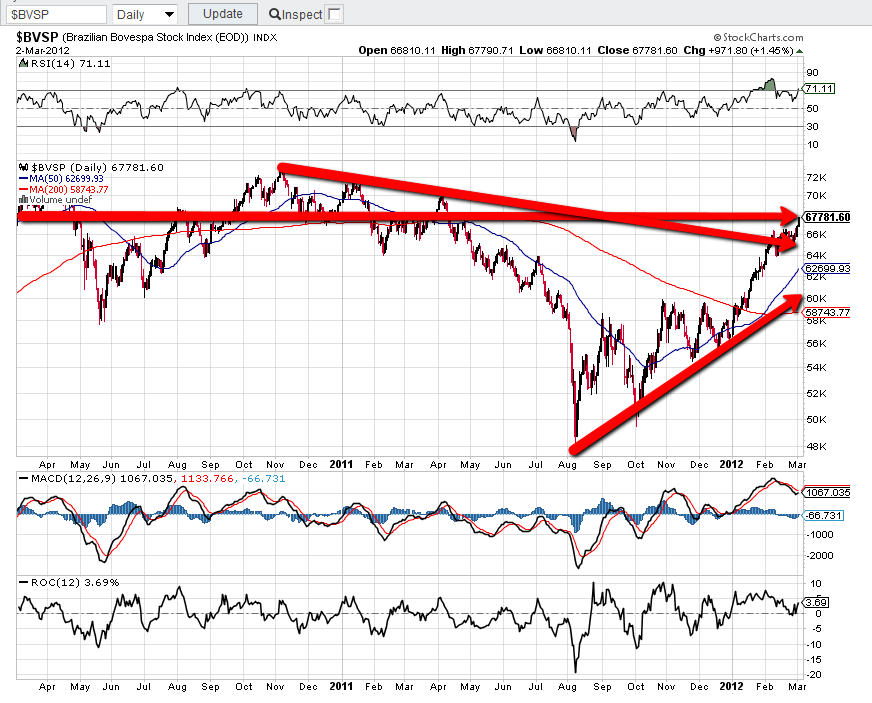
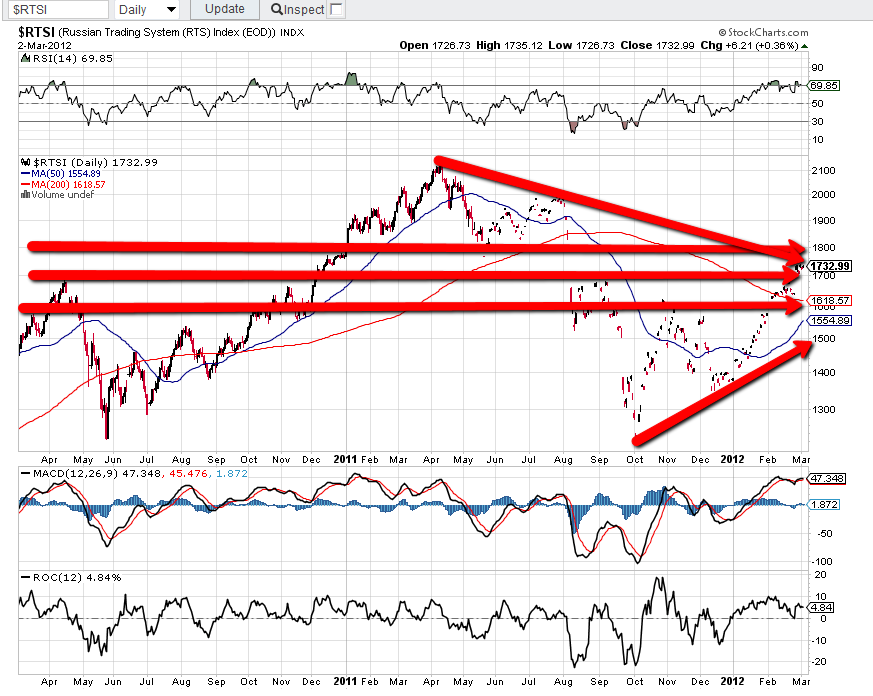
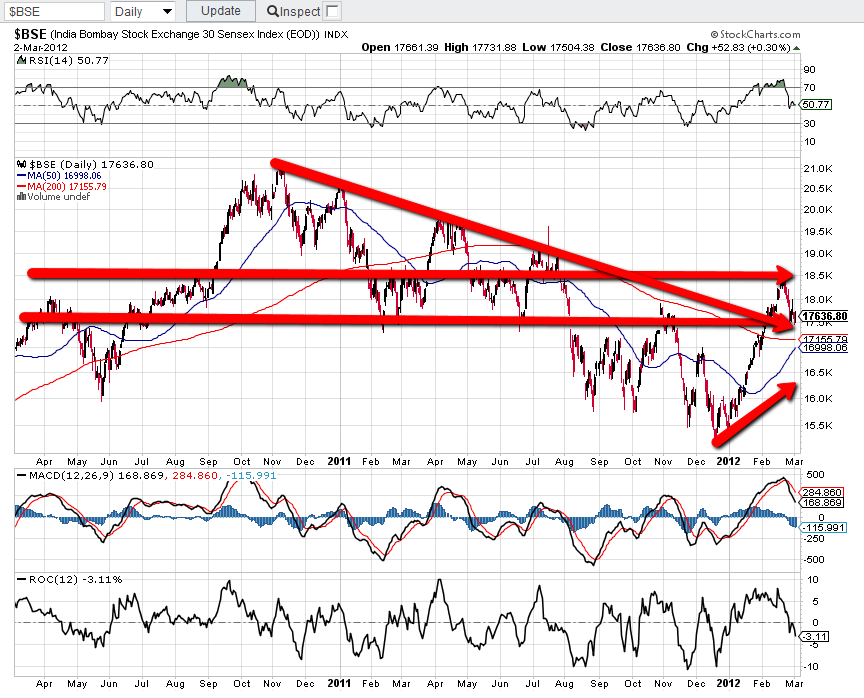
My post of February 27th made reference to the Emerging Markets ETF versus the BRIC countries. On that date, I mentioned that "Inasmuch as price on all of these instruments is trading below major resistance in the presence of negative divergences on indicators, and (with the exception of Brazil) are still subject to the influences of bearish moving average Death Cross formations, we may see a pullback occurring at some point soon. I'd keep a close watch on Russia and China for indications of possible weakness developing which may also affect the other indices and ETF…India has already been dropping and may be the signal that the others will follow suit."
As shown on the graph below, the Emerging Markets ETF and Brazil each gained 2% and 3.89%, respectively, with smaller gains made by India and China during the week. Russia made a minor loss.
As shown on the following five Daily charts below, the Emerging Markets ETF is still trading immediately below major resistance, Brazil has rallied during the week and sits below the next major resistance level, and Russia, India, and China still remain below major resistance. All of these instruments still have negative divergences on their indicators, and (with the exception of Brazil) are still subject to the bearish influences of the Death Cross formation. All ones to watch to see if weakness sets in over the next weeks.


Enjoy your weekend!
http://www.strawberryblondesmarketsummary.com/
