
Below are Monthly, Weekly and Daily charts of the SPX. The following is my top-down analysis as of today's close.
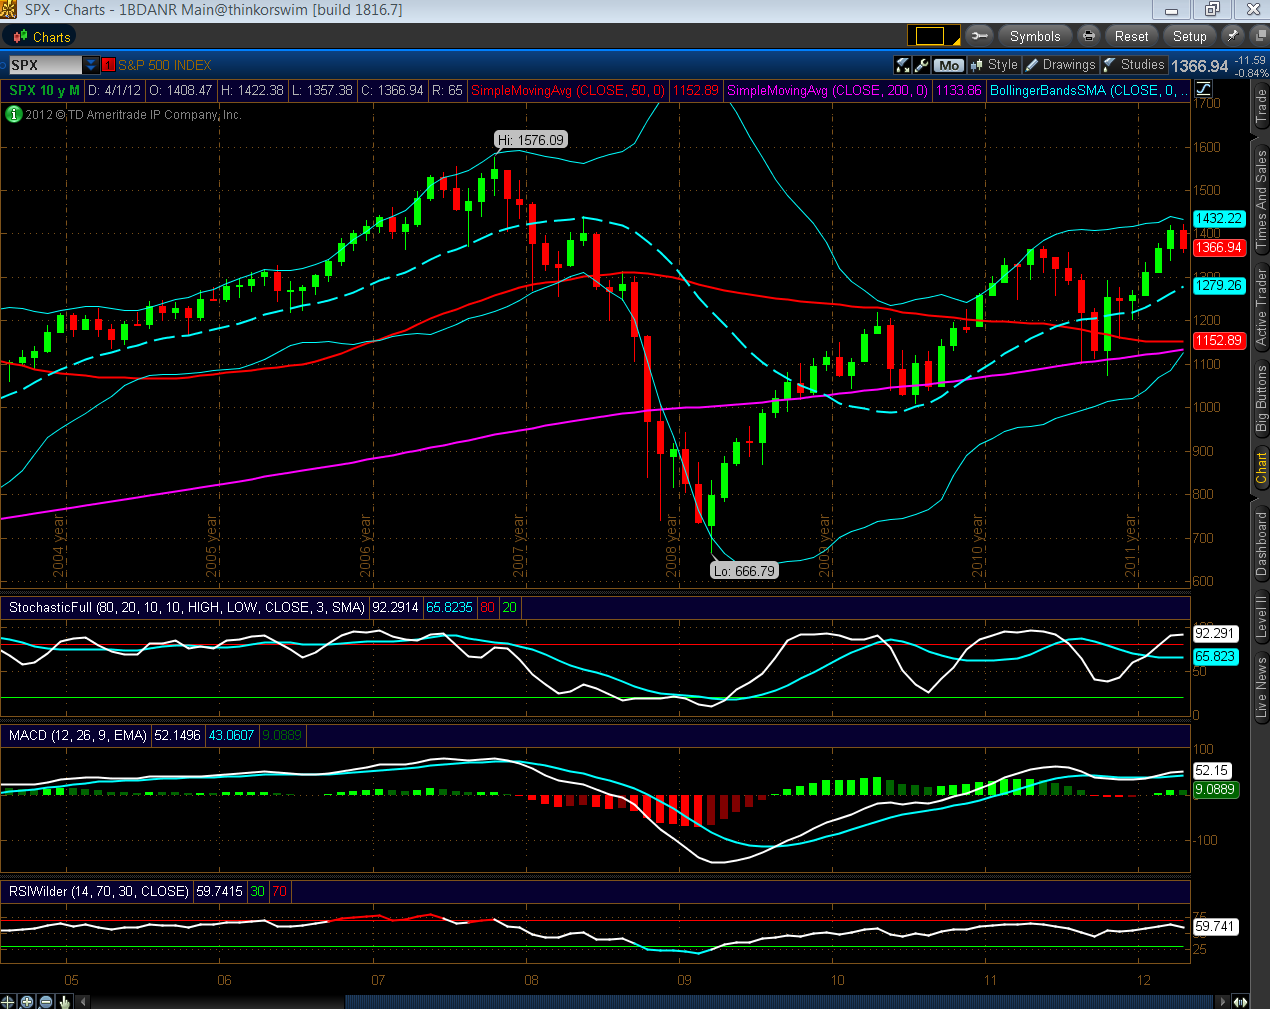
Monthly Timeframe: Although price made a higher swing high this year over last year's high, the Stochastics, MACD, and RSI indicators did not…upside momentum is decreasing on the MACD histogram, and the RSI is hooking down. Bollinger Bands are tightening, suggesting a change in trend to the downside. Price is just below the top Bollinger Band, with the next level of support being the middle Bollinger Band at 1279. The 50 sma (red) is in danger of crossing below the 200 sma (pink) and is near the bottom Bollinger Band, forming the next major support level around 1150.
Weekly Timeframe: Although price made a higher swing high this year over last year's high, the Stochastics, MACD, and RSI indicators did not…they have all hooked down, and the Stochastics and MACD have crossed over…and the MACD histogram has now crossed below zero, giving a 'sell' signal. Bollinger Bands are tightening, suggesting a change in trend to the downside. Price is sitting just above a near-term support at the mid-Bollinger Band at 1340, with the 50 sma acting as the next support level at 1280, followed by the lower Bollinger Band at 1235, and then the 200 sma at 1134.

Daily Timeframe: In spite of a series of higher swing highs in March of this year, the Stochastics, MACD, and RSI indicators made lower highs and have continued to trend lower…downside momentum increased again today as shown on the the MACD histogram, and the Stochastics is hooking down again. Price is approaching the lower Bollinger Band, which is widening, suggesting downside continuation. The trendline break of April 10th was confirmed again today after price failed to close above it and the 50 sma. The next major support level is at the 200 sma of 1273.

In summary, it would appear that further selling is in the cards for the SPX on all three timeframes, with their respective support levels noted above. I'd also refer you to my post of April 10th, which describes 1250 as a potential downside Fibonacci confluence support target.
