Further to my last weekly market update, this week's update will look
at:
- 6 Major Indices
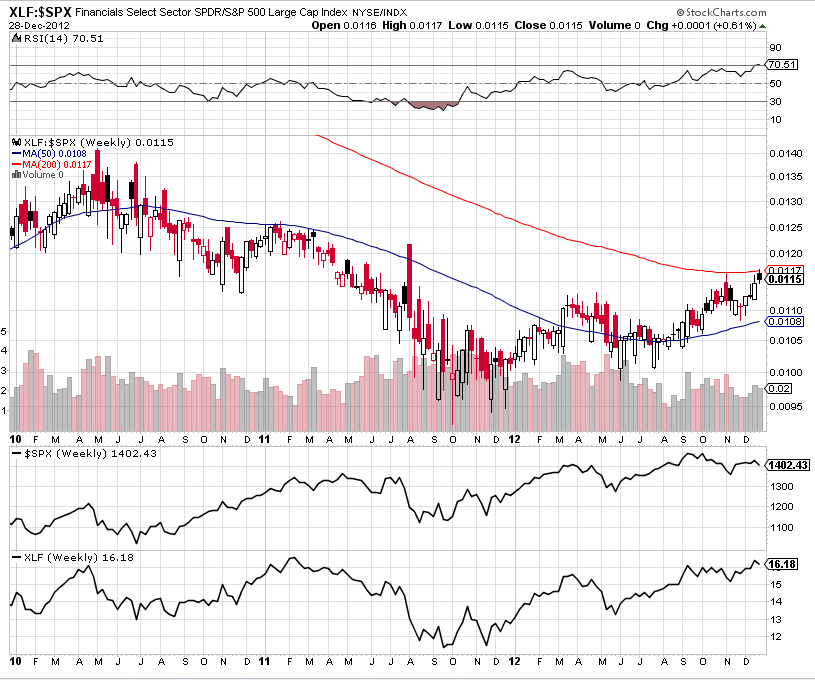
- 9 Major Sectors
- Index/Volatility Ratio Charts
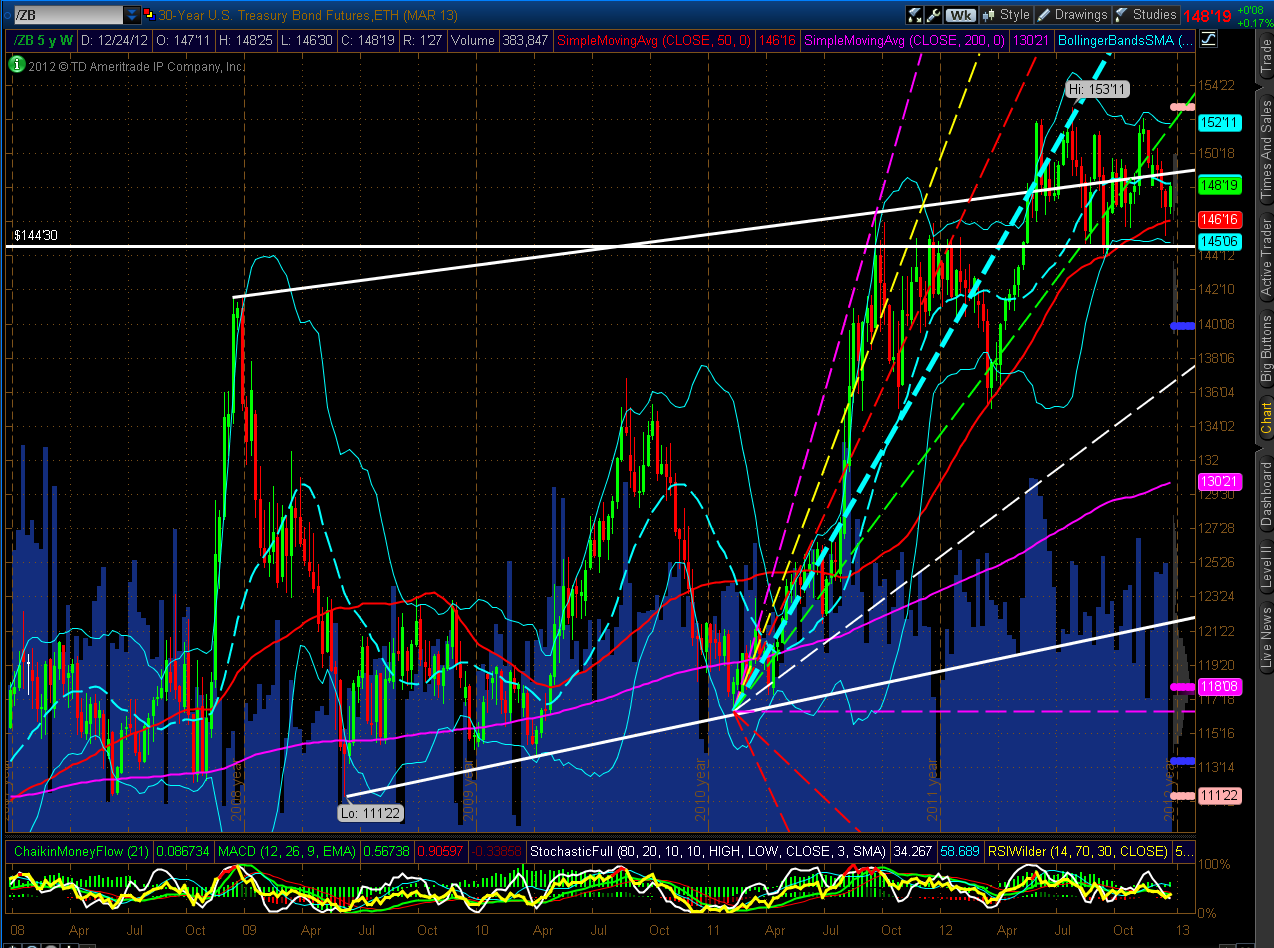
- 30-Year Bonds
- U.S. $
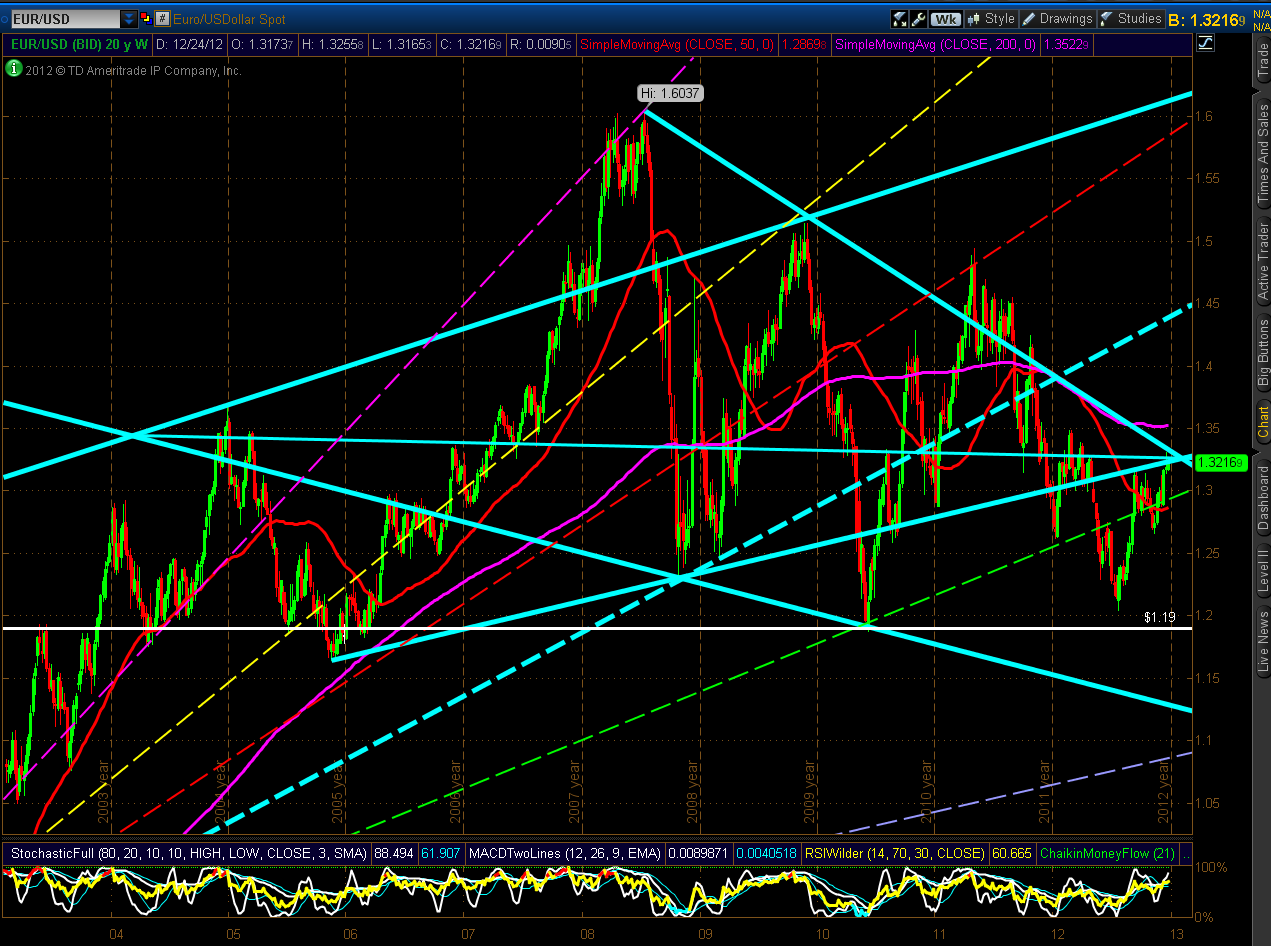
- EUR/USD
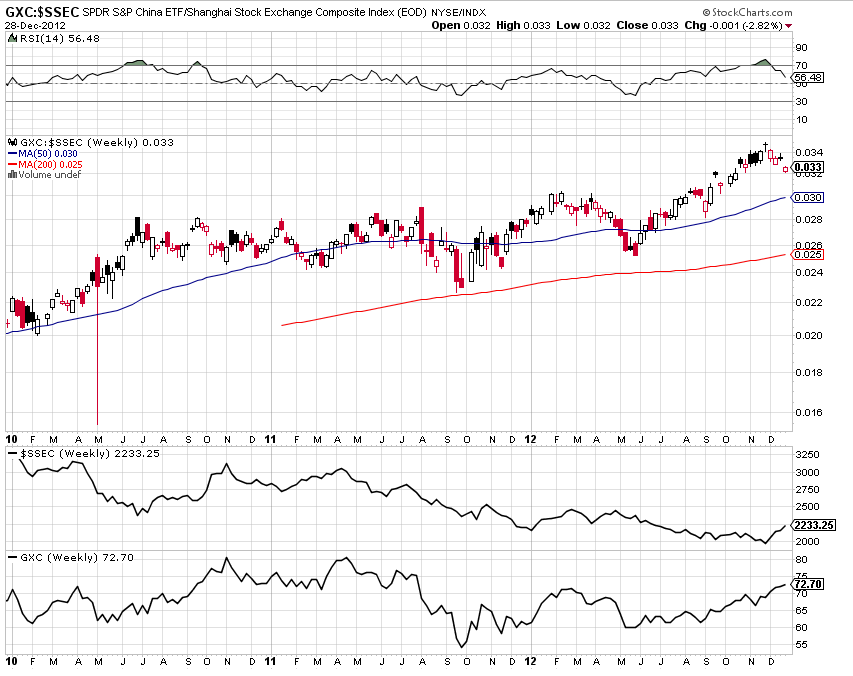
- Fed Monetary Stimulus Program "Canaries"
Last week I
said:
"In summary, we may continue to see volatile
intraday/overnight swings with little follow-through on lower volumes, until the
"Fiscal Cliff" issue is settled and until the end of the year, as fund managers
re-organize their portfolios for the 2012 year-end and Q4. At the moment, equity
markets still appear to be hedged in Bonds and the U.S. $ as they trade near
major resistance levels…this will likely continue until a convincing and
sustained breakout occurs in equities. As well, I continue to watch the Fed monetary stimulus program
"canaries" and the 1.3250ish resistance level on the
EUR/USD forex pair as possible indicators of equity weakness
that may become a cause for concern by bulls…at the moment, they are
signalling caution, as I discussed in those two articles this
week."
This past week, volatility increased and there was
profit-taking in all of the above, with the exception of the U.S. $, Euro, and
30-Year Bonds, as will be shown on the following charts and graphs…there will
be no commentary, as they are self-explanatory.
6 Major Indices


9 Major Sectors


Index/Volatility Ratio Charts


30-Year Bonds
U.S. $

EUR/USD
Fed Monetary Stimulus Program "Canaries"


In
summary, we may continue to see a repeat of last week's increase in volatility, profit-taking in equities, and hedging
in the U.S. $ and Bonds, until some sort of resolution of the "Fiscal Cliff" and
the Debt Ceiling Limit issues are reached that satisfies the markets. We'll have
to wait and see what comes from discussions and any votes held by politicians
over the weekend (or beyond).
I intend to publish another article after
Monday's close that summarizes the market action for Q4 and for
2012.
Happy New Year and good luck next week!