Further to my last weekly market update, this week's update will look
at:
- 6 Major Indices
- 9 Major Sectors
- Index/Volatility Ratio Charts
- 30-Year Bonds
- U.S. $
6 Major Indices
Inasmuch as today (Friday) was a Quadruple Options
Expiration, I'm showing the following chartgrid, where each candle
represents a 1-month options expiration period. You can see that the
current candle, which closed today, basically, bounced at/near the mid-Bollinger
Band. Price is stuck within a sideways range and is at/near major resistance.
We may see some retracement on the next candle, which begins on Monday,
before these indices either attempt to break out of and hold above this range
to, potentially, rally to their upper Bollinger Band, or retreat to lower
levels, such as their lower Bollinger/50 sma confluence major support levels.
You will note that the Dow Transports is already at its upper Bollinger Band and
the Russell 2000 is just below.
I'd watch the Russell 200 for either
leadership in a push upwards or a pullback.

The following
Year-to-date Weekly chartgrid shows the extent of this week's
gains, as does the following 1-Week percentage gained/lost
graph.
The largest gains were made in the Dow Transports and
Russell 2000 Indices.


9 Major Sectors
The first chartgrid also depicts a 1-month
options expiration period, with the current candle closing today. You
can see that all sectors retraced some or all of the prior period's pullback.
They are all in either longer or shorter-term sideways ranges, and are also
at/near major resistance, with Consumer Discretionary, Consumer Staples,
Healthcare, and Technology leading in overall gains from the 2009 lows.
We may also see some retracement on the next candle, which begins on
Monday, before these indices either attempt to break out of and hold above this
range to, potentially, rally to their upper Bollinger Band, or retreat to lower
levels, such as their lower Bollinger/50 sma confluence major support levels.
I'd watch the Consumer Discretionary and Staples, Healthcare, and
Technology Sectors for either continued leadership in a push upwards or a
pullback.

The following
Year-to-date Weekly chartgrid shows the extent of this week's
gains/losses, as does the following 1-Week percentage gained/lost
graph.
The largest gains were made in the Financials Sector,
while Consumer Staples lost some ground.


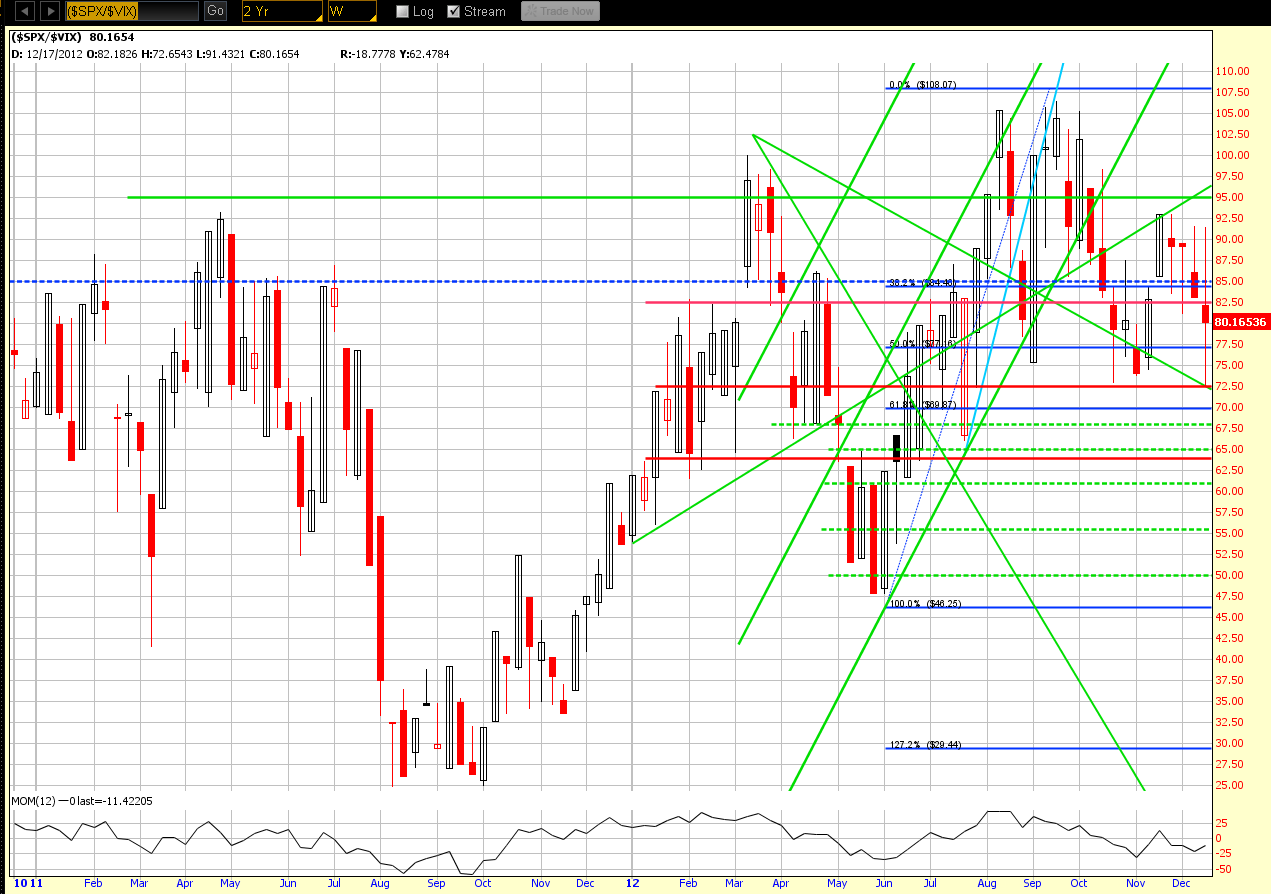
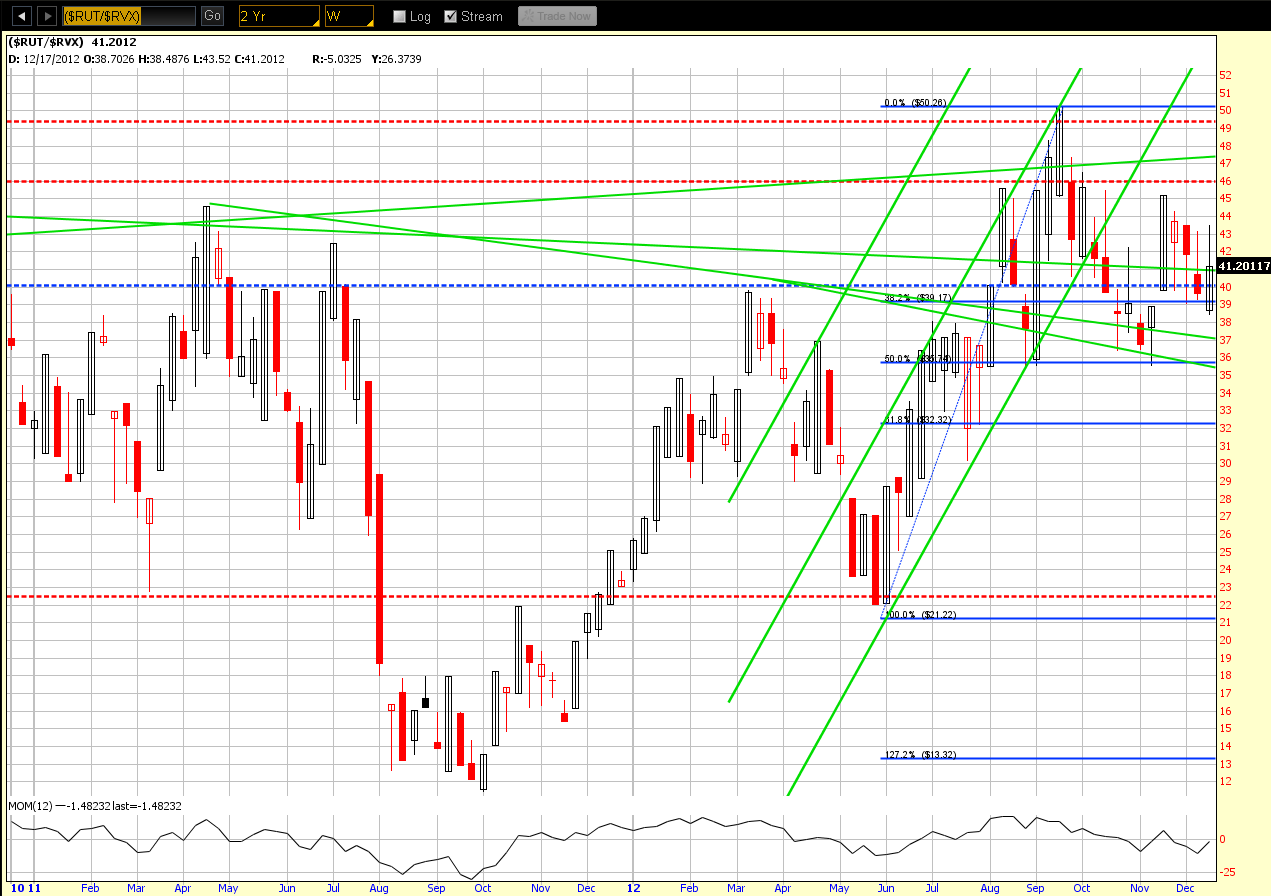
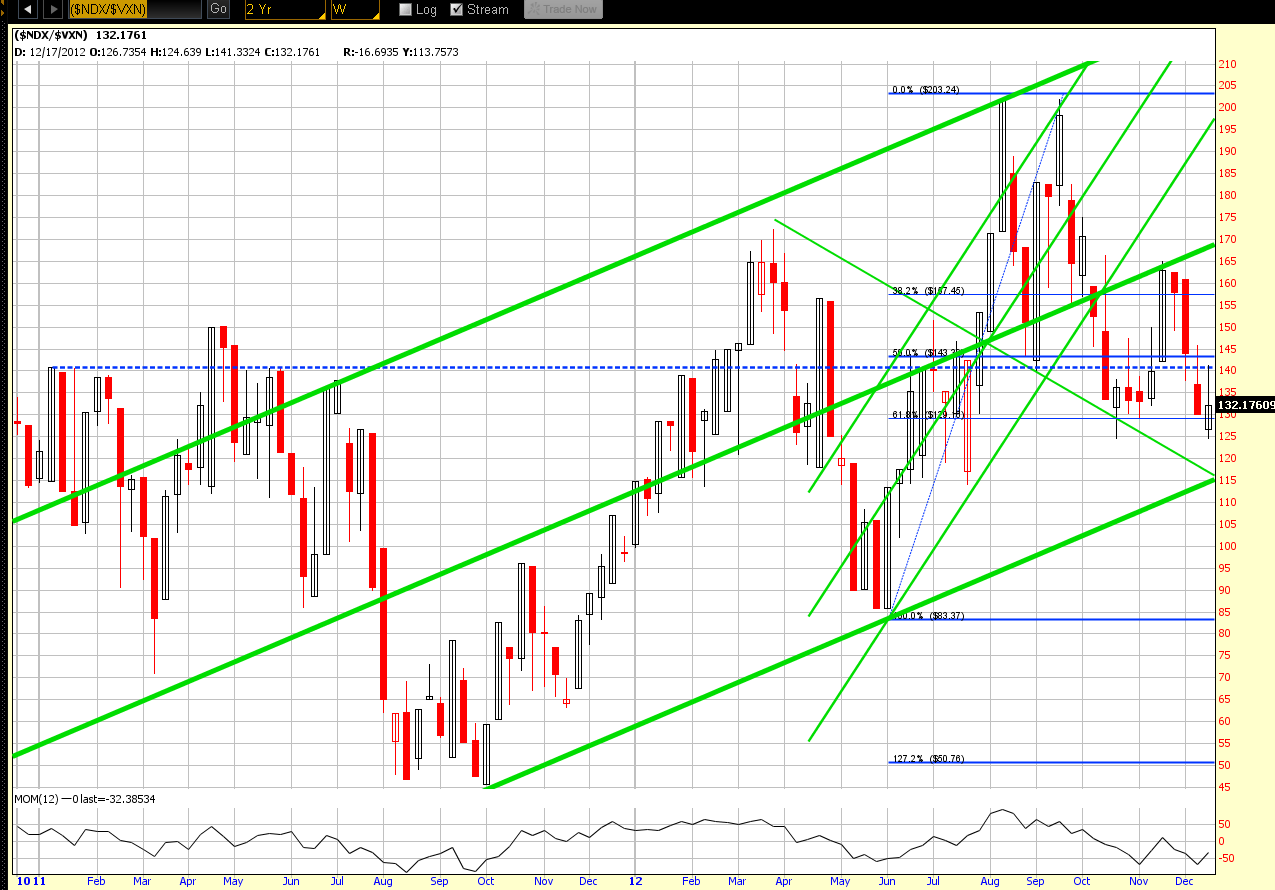
Index/Volatility Ratio Charts
Normally I'd show Daily charts, but
have opted to show the following 2-Year Weekly ratio
charts comparing the SPX, RUT, and NDX to their respective Volatility
Indices.
You can see that each one closed roughly in the middle of its
weekly candle, after a week of what was particularly high volatility for the
SPX…basically indicating indecision and lack of commitment in either direction
in these markets. The SPX:VIX and NDX:VXN ratio pairs closed below major
resistance (broken horizontal blue line), while the RUT:RVX ratio pair closed
just above.
With volumes expected to be lower overall next week during
the Christmas holidays, we could actually see an increase in volatility with
large moves and little follow-through…probably something we'll continue to see
until a deal is (presumably) reached before the end of the year on the "Fiscal
Cliff" issue.
30-Year Bonds
The Weekly chart below of 30-Year
Bonds shows that price also finished near the middle of this week's candle and
is back in the middle of a longer-term sideways trading range from mid-May…so,
there is no indication of panic selling in these bonds, yet.

U.S. $
The Weekly chart below of the U.S. $ shows
that price finished near the top of this week's candle and at the Volume Profile
POC (point of control) for the past 5 years. It's been in a 2-point trading
range since mid-September, and remains the risk-on/risk-off trade, along with
30-Year Bonds.

In
summary, we may continue to see volatile intraday/overnight swings with
little follow-through on lower volumes, until the "Fiscal Cliff" issue is
settled and until the end of the year, as fund managers re-organize their
portfolios for the 2012 year-end and Q4. At the moment, equity markets still
appear to be hedged in Bonds and the U.S. $ as they trade near major resistance
levels…this will likely continue until a convincing and sustained breakout
occurs in equities. As well, I continue to watch the Fed monetary stimulus program "canaries" and the 1.3250ish resistance level on the EUR/USD forex pair as
possible indicators of equity weakness that may become a cause for concern by
bulls…at the moment, they are signalling caution, as I discussed in those two
articles this week.
Merry Christmas and have a safe and Happy Holiday
week. Good luck to anyone trading next week!