
My post of February 28th of this year gave an 80% chance of
another spike on the VIX this year. While that scenario threatened to occur
mid-year, volatility subsided and has remained relatively quiet this year.
However, with only three trading days left, I thought I'd provide an update on
this topic.
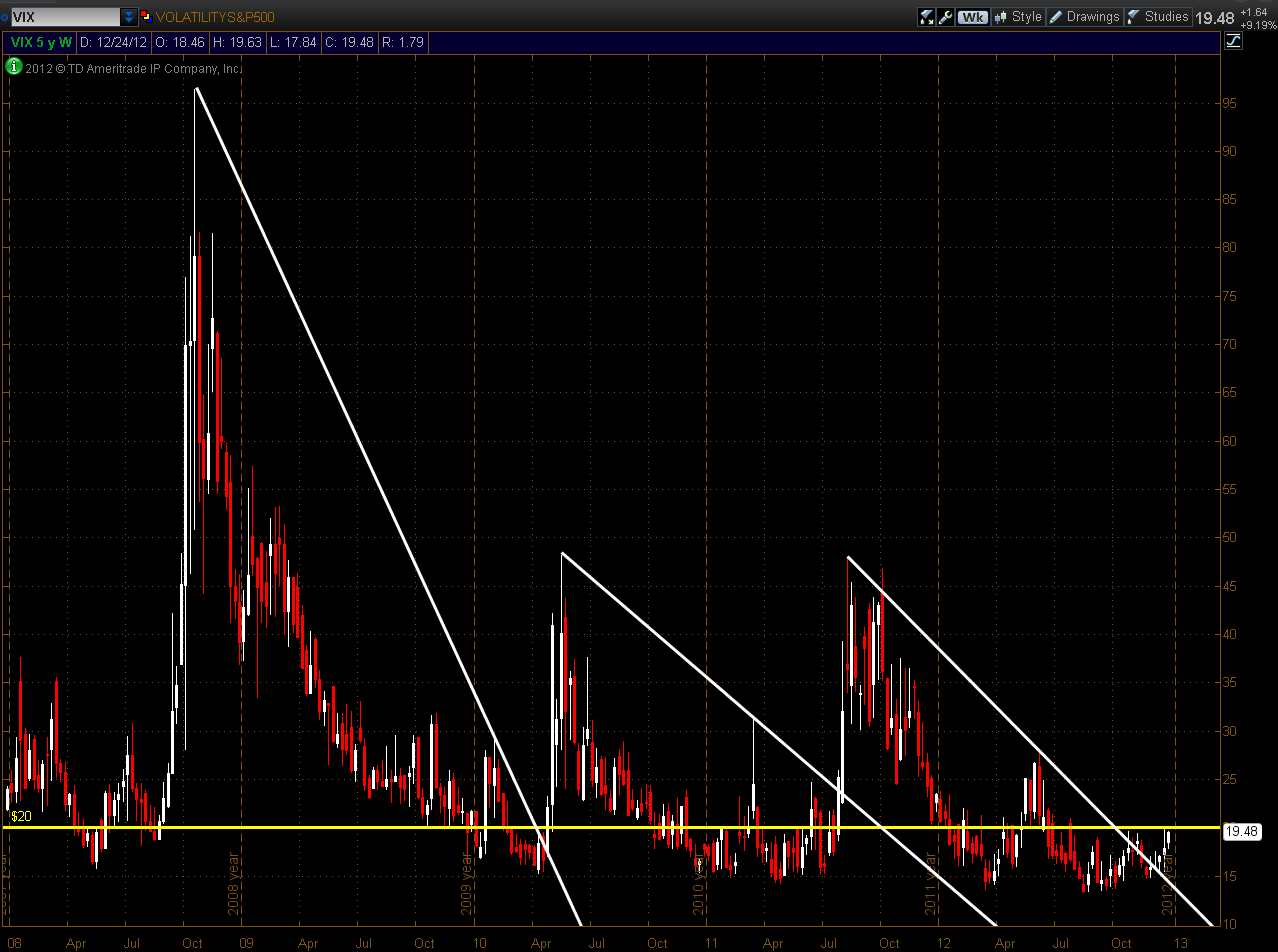
The Weekly chart below shows the VIX
pushing up against a major resistance level around
20.00. A close and hold above 20.00 may produce such a
spike…if not this year, then in (possibly early) 2013.
The Weekly
ratio chart of the SPX:VIX shows that the SPX has
weakened on rising volatility, that price has fallen below a major support
level, and that the Momentum indicator has fallen below zero again, after
failing to continue pushing to new highs.

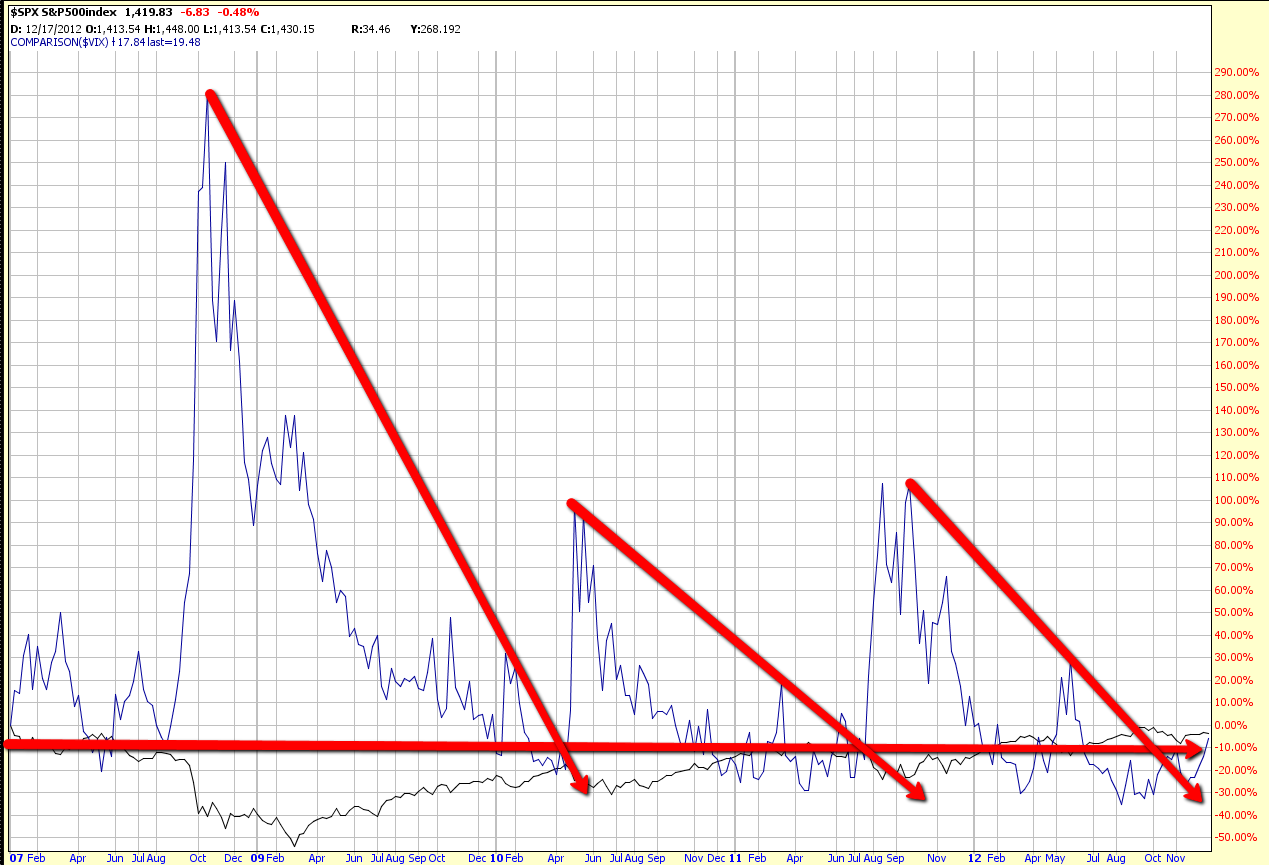
The Weekly
comparison chart below of the SPX and the
VIX confirms that volatility is overtaking any former strength of the
SPX at the moment.
All in all, these
three charts are worth tracking over the next few days/weeks, particularly as
the "Fiscal Cliff" issue remains unresolved and the "Debt Ceiling Limit" is fast
approaching, giving extra fuel to the high odds of another spike in the VIX,
sooner rather than later. After all, Ben Bernanke did say recently that Fed
monetary policy alone cannot solve America's unemployment and economic woes…a
change in fiscal policies will be required, and without bi-partisan cooperation
on these (and many other such) issues, I would say we'll see a spike in the VIX
at some point soon.
