
It has been a little while since I’ve done a post here, but the returns in the model portfolio have been steadily rising. We are now up 8.4% since February.
With gold finally waking up over the last couple of days, I thought it was high time that we checked on the how GDX was doing technically. Specifically, I wanted to figure out what the chances were for further downside movement, or whether GDX had formed a bottom and it was time to jump in.
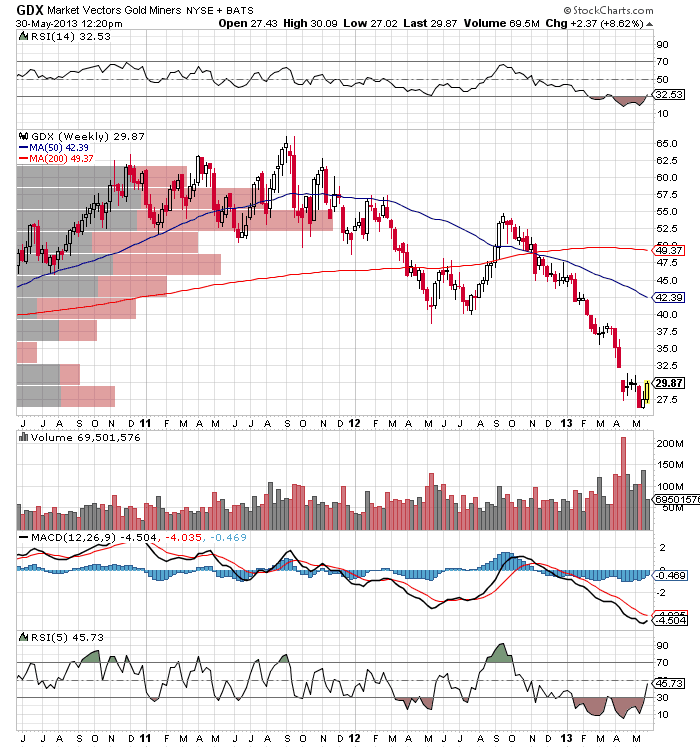
First, let’s look at the longer-term chart and the volume profile relative to price.

What I see here is that GDX can easily run up to $35, which is the top quartile of the volume hole. After that, the rise in price will be increasingly difficult to obtain, mostly because of knife-catchers who bought on the way down and will likely look to unload as they start coming into profits. The biggest barrier to overcome is the $52.50-55 range, a major bull-bear zone.
In the near-term on the daily chart, however, there is enough of a volume hole to take GDX to ~$37 before sellers will step in. This is shown in the chart below:
What is particularly intriguing about GDX is the next chart. What it shows is the Fib levels from the lows of 2009 used as a basis (done in Prophet!!!). You can see that GDX last week touched the 78.6% Fib line nearly perfectly and has since bounced from there. It’s a thing of beauty.
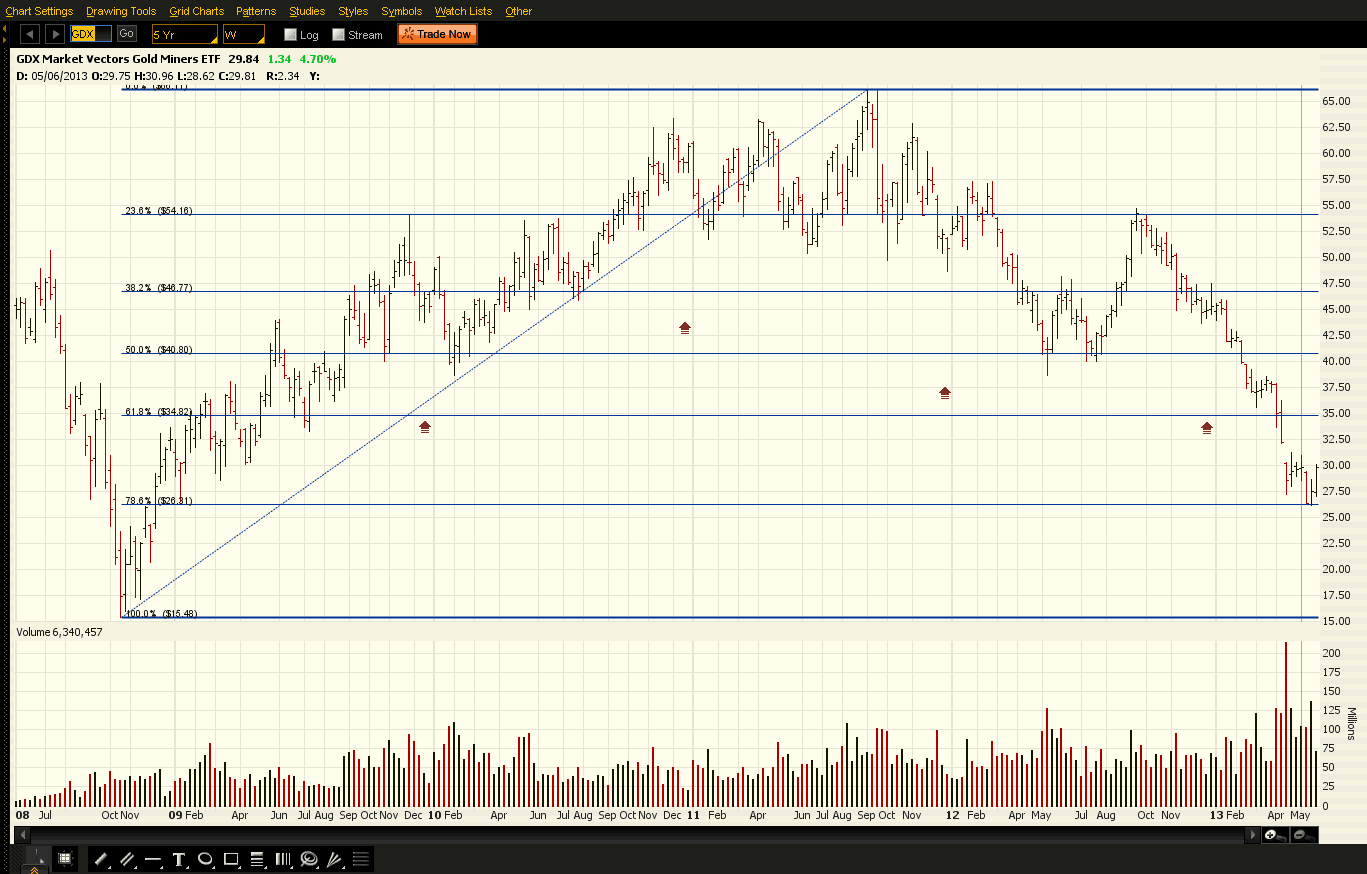
I am calling the fall in GDX done. It may not go straight up from here, but I see much higher prices ahead.
Follow me @ http://protectedreturns.blogspot.com/
Happy Trading!
