
Before we publish the ES Quantitative Analysis for today, a couple of clarifications:
1) the Analysis product presented here is NOT a trading system, in other words we simply use our quantitative metrics to analyze the chances (odds) for the ES market to change trend direction at certain price levels – the decision about Position Sizing, Stop Loss and exact price trading execution levels are entirely up to the single trader/investor
2) our analysis is re-updated every day on the side of the impulse that did not change, for example currently the ES market has been closing up 2 days in a row (today may be the third), so we are only updating the LONG version of the trades, since yesterday’s UP Close has generated new LONG price levels. The SHORT trades are unchanged from yesterday. For your convenience we’ll always publish both the LONG and SHORT analysis, but usually only one of the two (the “changed” one) will contain significant updates.
3) after yesterday’s very long introductory post, today we are going to limit our observations to price levels and related odds of reversal.
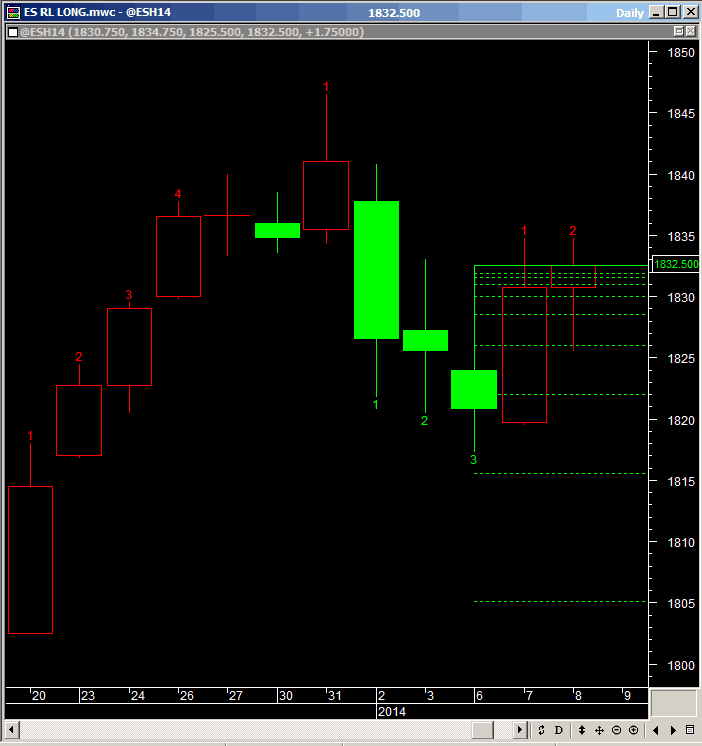
TO GO LONG ANALYSIS
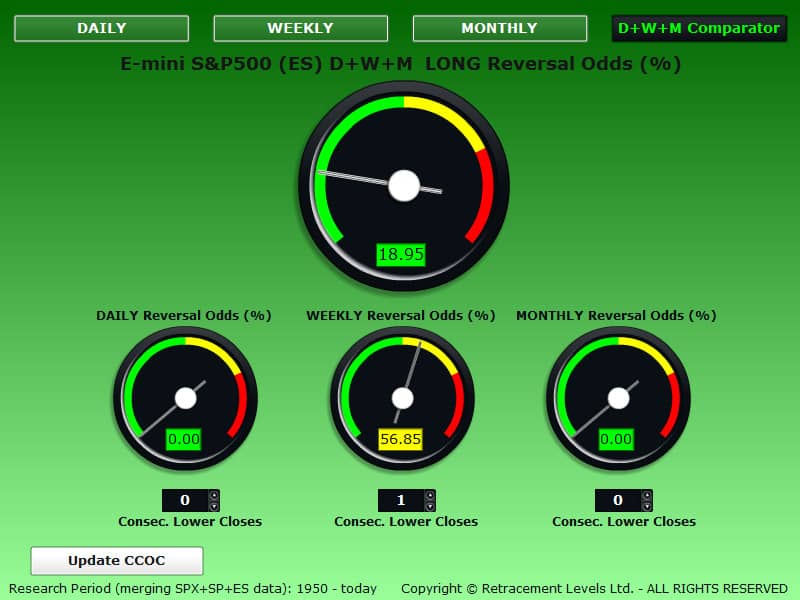 The CCOC DAILY gauge below is showing 0% odds to GO LONG.
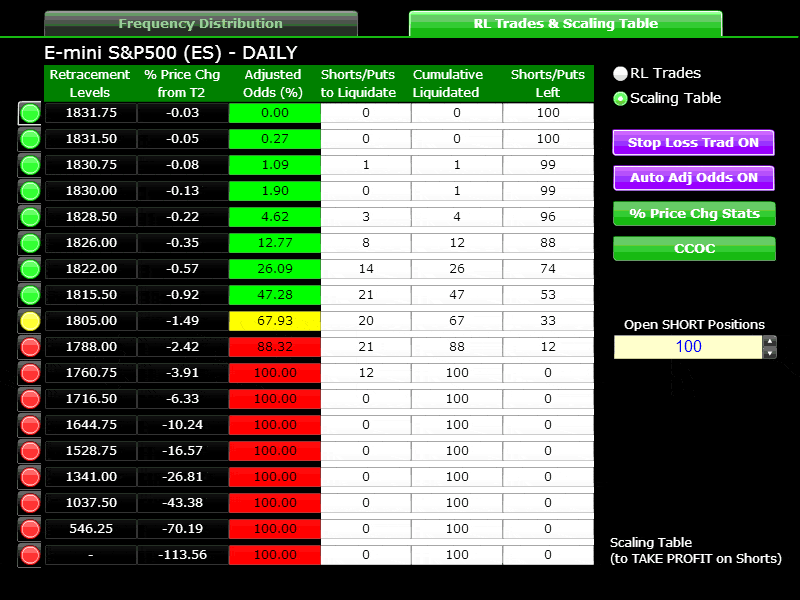
DAILY 26.09% Odds
WEEKLY 8.97% Odds
MONTHLY 6.67% Odds
OVERALL 13.91% Odds
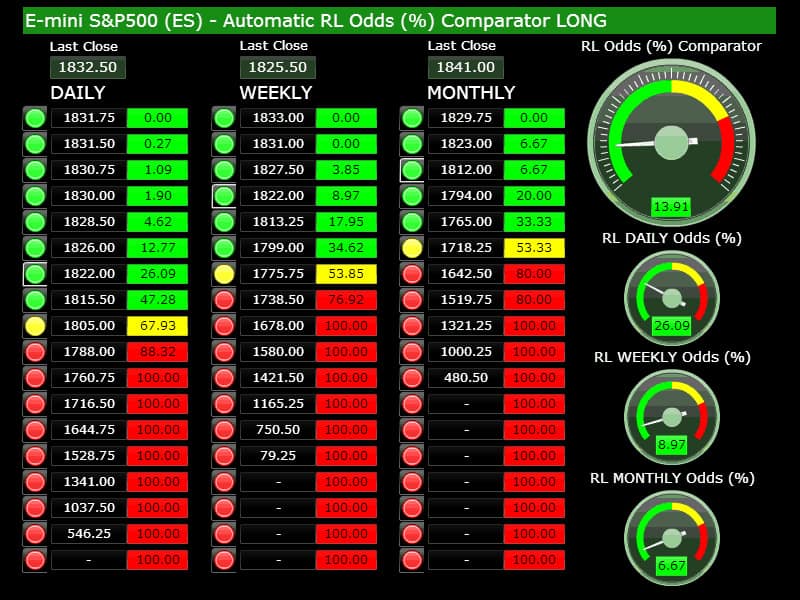
Our comment to the above Daily+Weekly+Monthly Comparative Odds analysis is that unless the market reaches significantly lower levels the odds for a LONG trade are not particularly good, so we would shy away from long-term LONG trades in this phase.
In the short-term, buying dips can surely produce profits but today is the third consecutive day up in a row, we would prefer to buy dips on the first or second day up, now is too late, the market will probably reverse SHORT between Friday and Monday and there is where you can buy again.
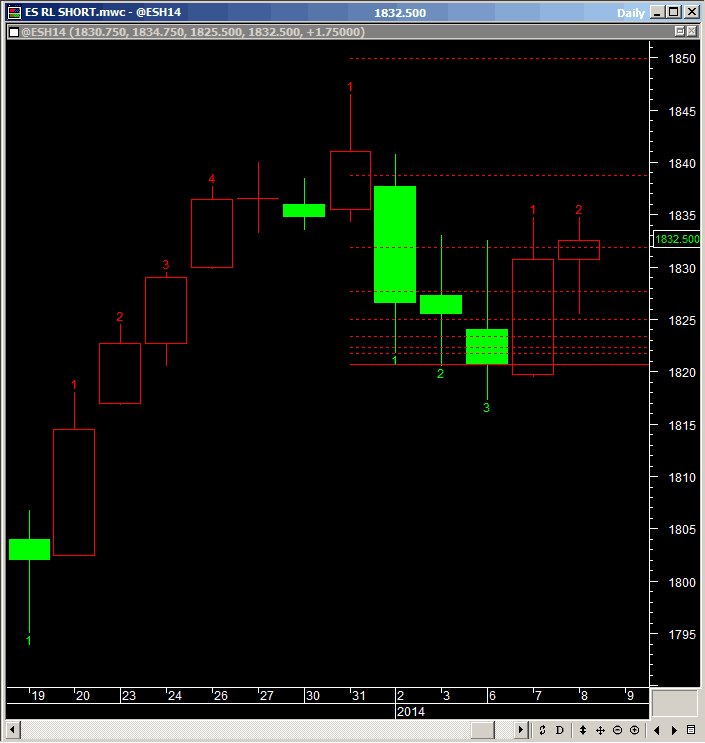
TO GO SHORT ANALYSIS
Here below you can see the SHORT chart: it has not changed from yesterday.
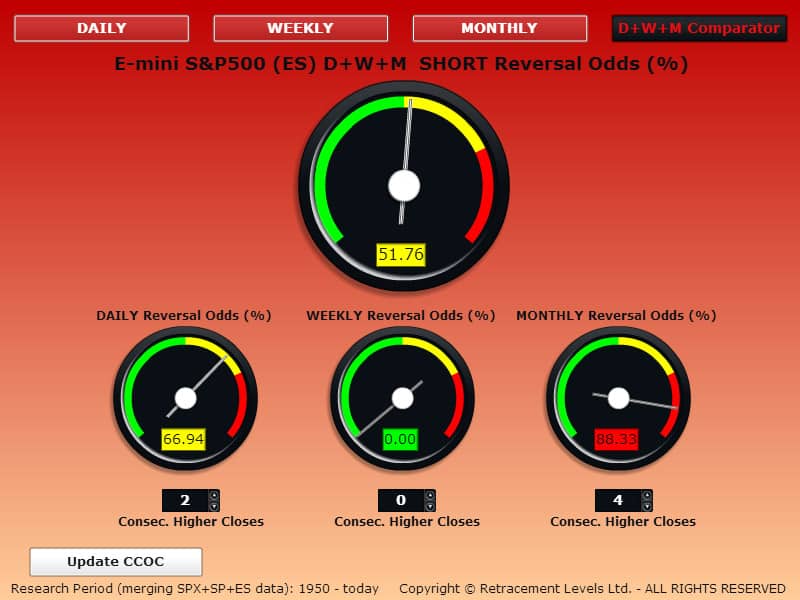
The CCOC DAILY gauge below is showing good odds to GO SHORT.
On the SHORT Odds Table below we have the following relevant levels:
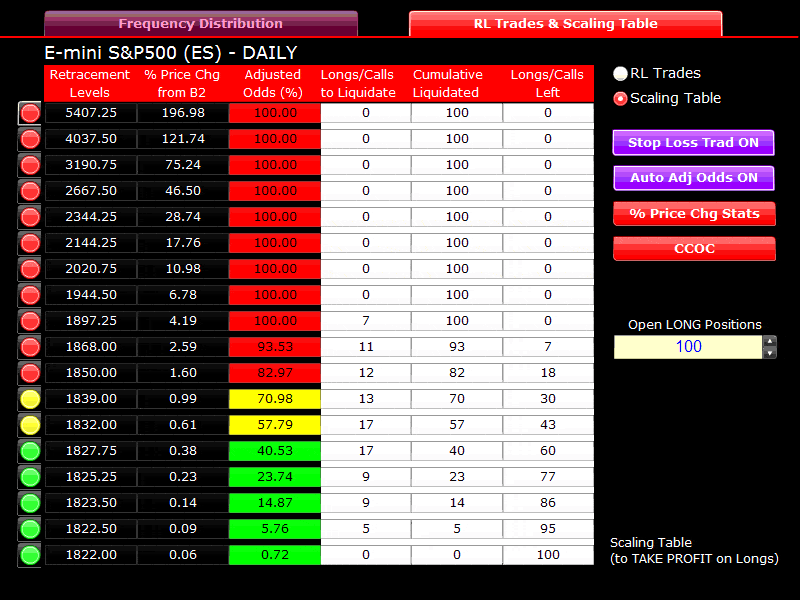
The ES SHORT Odds Comparator below show us what the odds would be if the price area near 1839 would be reached (note: this DAILY price level has been reached overnight):
DAILY 70.98% Odds
WEEKLY 10% Odds
MONTHLY >81.25% Odds
OVERALL 54.08% Odds 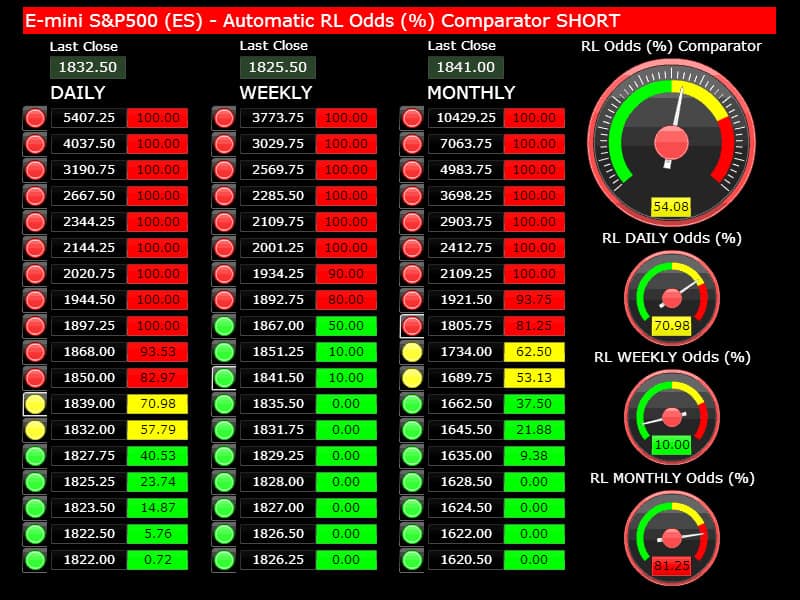
Our comment to the above Daily+Weekly+Monthly Comparative Odds analysis is that the market is quite overbought Monthly and the Daily as well it’s reaching overbought levels, so a Daily correction (at least one day down) is becoming more likely and if there is a catalyst, it may turn into a Monthly correction. The Weekly at the moment is not overbought (because it closed down last week), but this may be read as a Weekly downtrend that has already started, and so the current upswing may be some sort of Daily re-test of the latest highs at 1846.50 – if that happens during the current upward impulse, then 1850 would be the perfect place for a big, medium-term SHORT bet, with a chance to see the market correcting down for the whole month.
We will re-update you on all this tomorrow.
Copyright © 2014 Retracement Levels. All Rights Reserved
