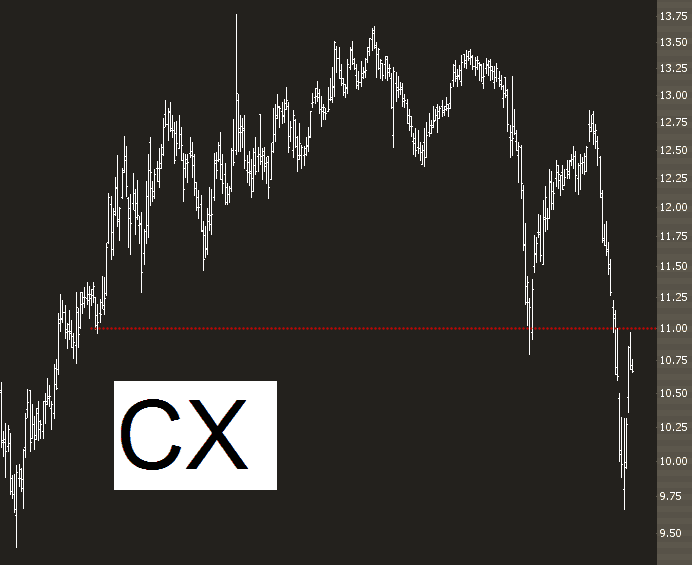
Traffic is understandably light this week here on Slope, so I’m going to do a lazy post: here is a trio of interesting charts to consider for shorting.
Slope of Hope Blog Posts
Slope initially began as a blog, so this is where most of the website’s content resides. Here we have tens of thousands of posts dating back over a decade. These are listed in reverse chronological order. Click on any category icon below to see posts tagged with that particular subject, or click on a word in the category cloud on the right side of the screen for more specific choices.
Icing The Cake
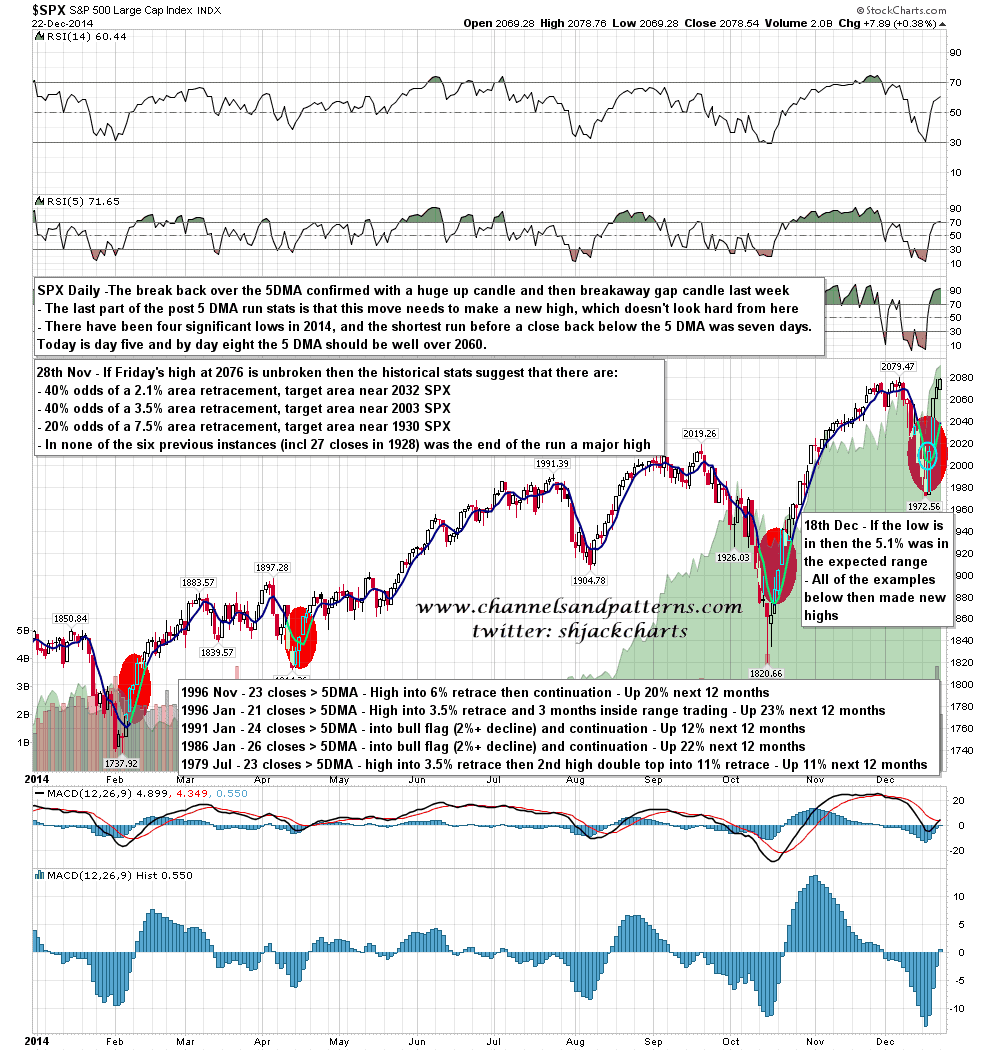
Over the last four weeks, since SPX broke back below the 5 DMA after the (all time longest) run over it from the 1820 low, I’ve been using the stats from the largest previous runs to call the likely moves afterwards. We are almost at the end of those stats now, with the last part being to make a new high. That’s already been done on globex overnight but needs to be done in regular trading hours as well.
After that’s done I’d mention that the shortest run over the 5 DMA from a significant low this year was eight days, and we are currently on day five. By day eight I’d expect the 5 DMA to be well over 2060. SPX daily 5 DMA chart: