
Our Current Number One Stock: Activision Blizzard
Activision Blizzard (ATVI), which just announced its purchase of King Digital (KING), the Dublin-based maker of the Candy Crush mobile game, currently has the highest potential return of any security in Portfolio Armor‘s universe, at 20.8%. Potential return, in our terminology, is a bullish estimate of how a security will perform over the next 6 months. Below, we’ll explain how we calculate potential return, and then we’ll show a couple of ways of hedging ATVI.

How We Calculate Potential Return
Essentially, we start with the assumption that a security’s return over the next six months will begin to revert to its long term mean six–month return. Then, we test that assumption by looking at the prices of options on the security that expire in approximately six months. That test of option market sentiment gives a forward–looking element, because it represents the views of option market participants on where the underlying security is likely to be several months out.
We backtested this security selection method by running our analysis every trading day from 1/2/2003 to 10/31/2013 and then looking at the actual returns of the securities with the highest potential returns on our daily scans over the next six months. Over that 11–year period, we conducted 25,412 comparisons of our calculated potential returns to actual returns, an average of 9.4 top–ranked securities each trading day. The average potential return we calculated was 22.4%. The average actual return over the next six months, unhedged, was 6.84%. Since the average actual return was 0.3x the average potential return, we use that 0.3x multiple to derive expected returns from our potential returns. While a potential return represents a bullish upside, an expected return is the more likely result.
To give an idea of the sort of names that currently score highly according to this method, these were the top four names after ATVI on our ranking as of November 3rd:
- Alphabet (GOOGL)
- Nike (NKE)
- Expedia (EXPE)
- Regeneron (REGN)
Two Ways of Hedging ATVI
Here are two ways of hedging ATVI against a >20% drop by May. Although our top–ranked names perform well on average, sometimes they crash, so crash–protection can be helpful – as it was when Sketchers (SKX) tanked 31% in one day recently.
With Optimal Puts. Upcapped Upside, Higher Cost
These were the optimal puts, as of Tuesday’s close, to hedge 500 shares of ATVI against a > 20% drop by May (screenshots below via the Portfolio Armor iOS app).
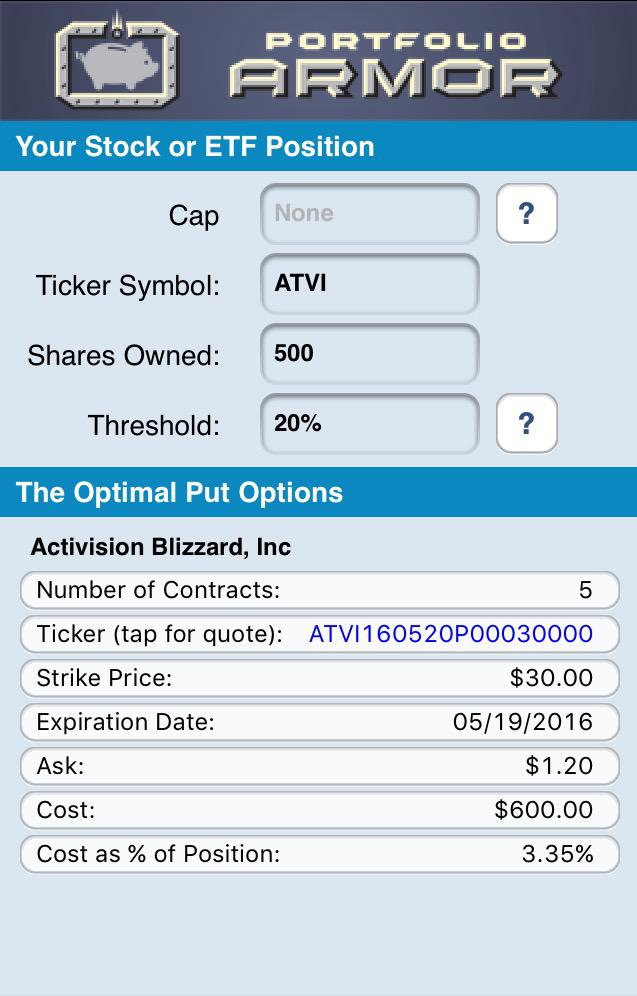
As you can see at the bottom of the image above, the cost of this protection was $600, or 3.35% as a percentage of position value. Note, though, that this cost was calculated conservatively, using the ask price of the puts; in practice, you can often buy the puts for less (at some price between the bid and ask).
With an Optimal Collar. Capped Upside, Lower Cost
Here we hedge ATVI against the same decline threshold while capping its upside at the potential return we’ve calculated for it, 20.8%.
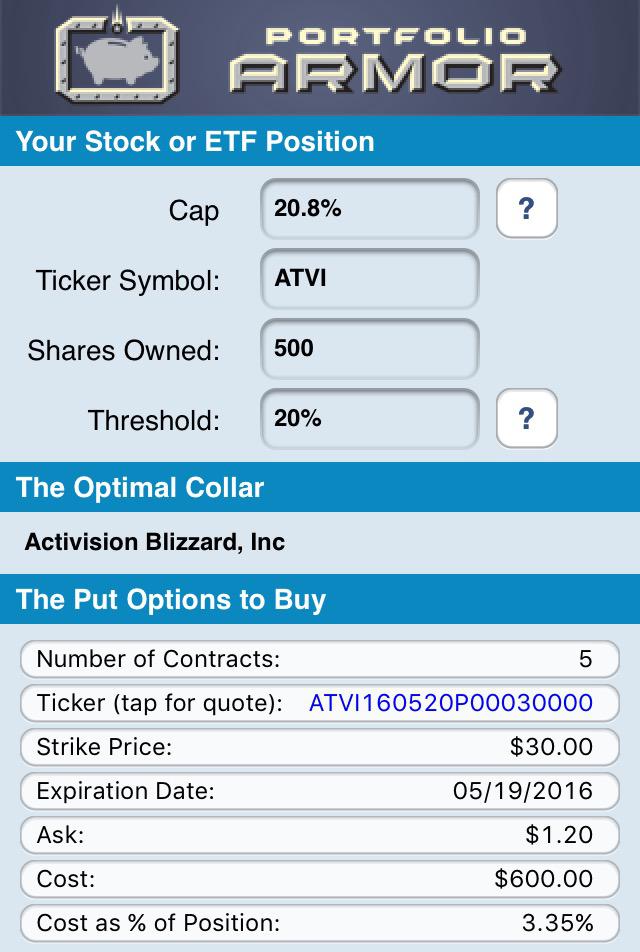
In this case, the put leg of the collar is at the same strike as the optimal put — often, that’s not the case. In any case, the cost of the put leg is the same, as you can see above, $600, or 3.35% as a percentage of position value. But if you look at the call leg below, you’ll see the income generated from selling the calls was $315, or 1.76% as a percentage of position value.
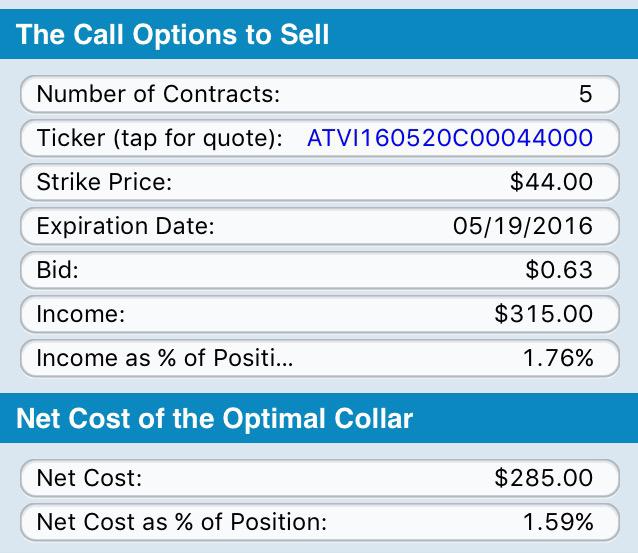
So the net cost of this optimal collar was $285, or 1.59%, as a percentage of position value. However, as in the case of the optimal put above, the cost here was calculated conservatively (assuming the puts were bought at the ask and the calls sold at the bid), so, in practice, an investor likely could have opened this collar for less.
