

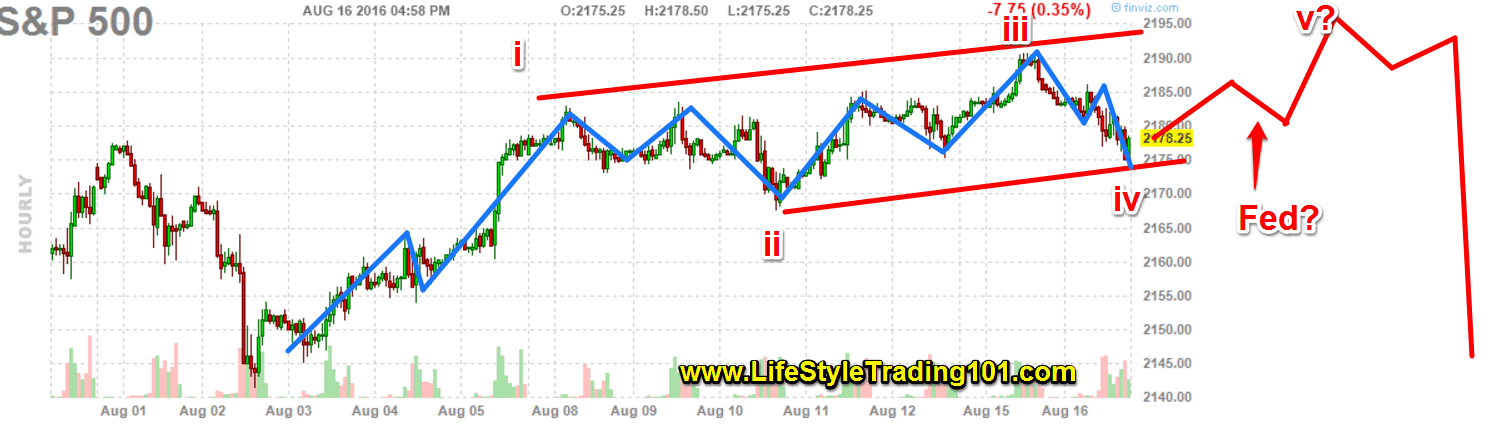
Today we sold off into the 4pm EST close at 2175ES (E-mini S&P500 Futures) as we had into Fed minutes for tomorrow Wednesday at 2pm. That’s the first time in a while where we ended the day at the lows.
Is that a bearish sign? And what happens next?
Well, if what happened today is a 4th wave, then it’s possible to have an a-b-c 5th wave up according to the red line.
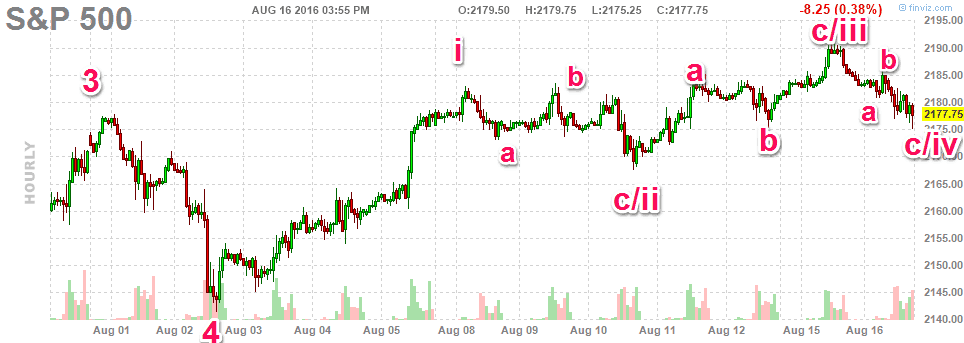
Without the blue and red lines, here’s the same chart:
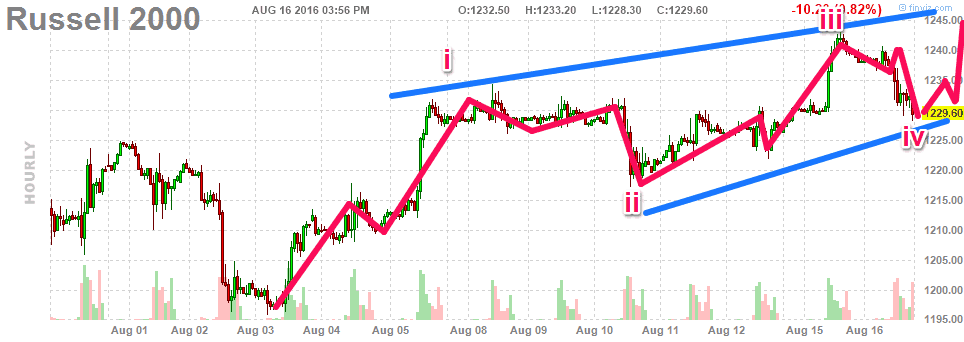
The Russell chart also shows an ending diagonal pattern.
 There’s no guarantee that this chart pattern will play out – or that I recognized it properly. But as long as 2175 ES holds as support, this remains a possibility.
If broken, however, downside towards 2140 ES is likely.
Additional charts and predictions available at www.lifestyletrading101.com and in our investment newsletter.
