Further to my post of April 10, 30-Year Bonds have gained a couple of points, as shown on the Monthly chart below.
Price now sits just above major resistance (50% Fibonacci retracement) and is poised to begin reversing the steep plunge that began in mid-2016.

Furthermore, price has now broken above the 50-day moving average of the USB:SPX ratio and is currently at the major resistance level of 0.65, as shown on the Daily ratio chart below.
Inasmuch as we’re close to seeing a new “BUY” signal form on all 3 technical indicators, I’d keep an eye on this ratio to determine its strength versus equities in the coming days/weeks (particularly, in light of my comments of May 17), especially, if it breaks and holds above 0.65. If it does, its next target would be the 200-day moving average at 0.70.

As an aside, I’d add that, in the midst of the current political chaos emanating from the White House, President Trump may end up remaining in power for 4 years, but if, in the meantime, he’s widely regarded by domestic and foreign political players, as well as the American public, as untrustworthy (in spite of future facts and conclusions reached on current political and intelligence investigations), his tenure could very well end up being unremarkable and devoid of any major accomplishment.
In that kind of environment, this would NOT be a wagon that equity markets could confidently hook up to in a sustainable way, without the risk of accompanying high volatility, in my opinion.
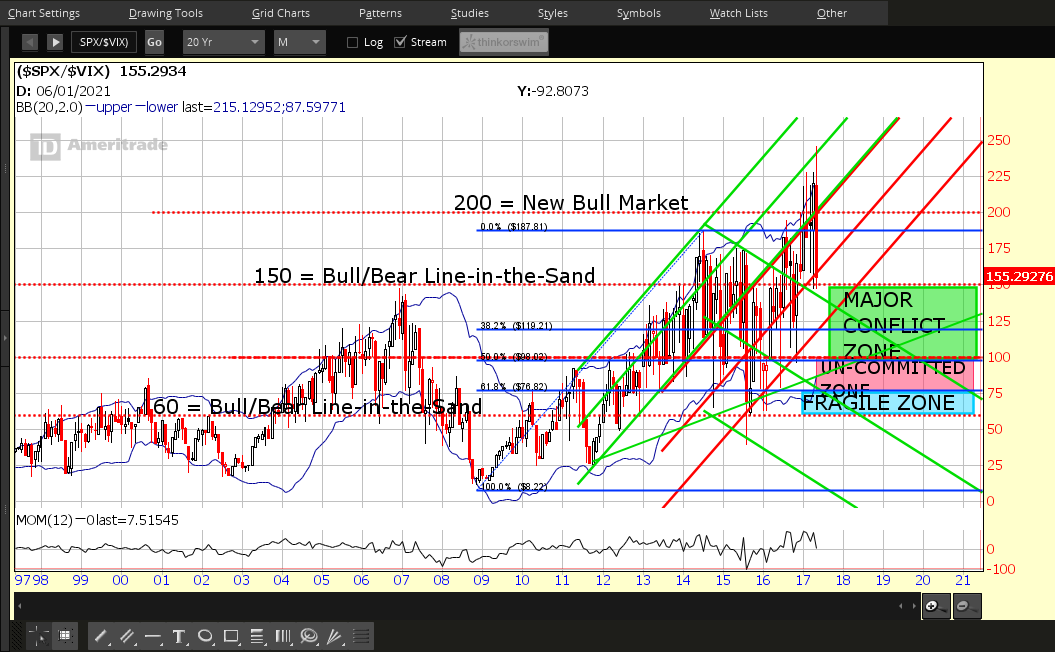
In this regard, watch for a break and hold below the 150 major support level on the SPX:VIX ratio, as well as a drop and hold below zero on the Momentum indicator, as shown on the Monthly ratio chart below.
In that case, volatility will remain elevated and we’ll see larger intraday and overnight equity swings.